The resulting plots are the frequency response of output/input for each measurement.
For more information regarding these traces, please refer to the Advanced Tuning For Velocity and Position
Loops documentation.
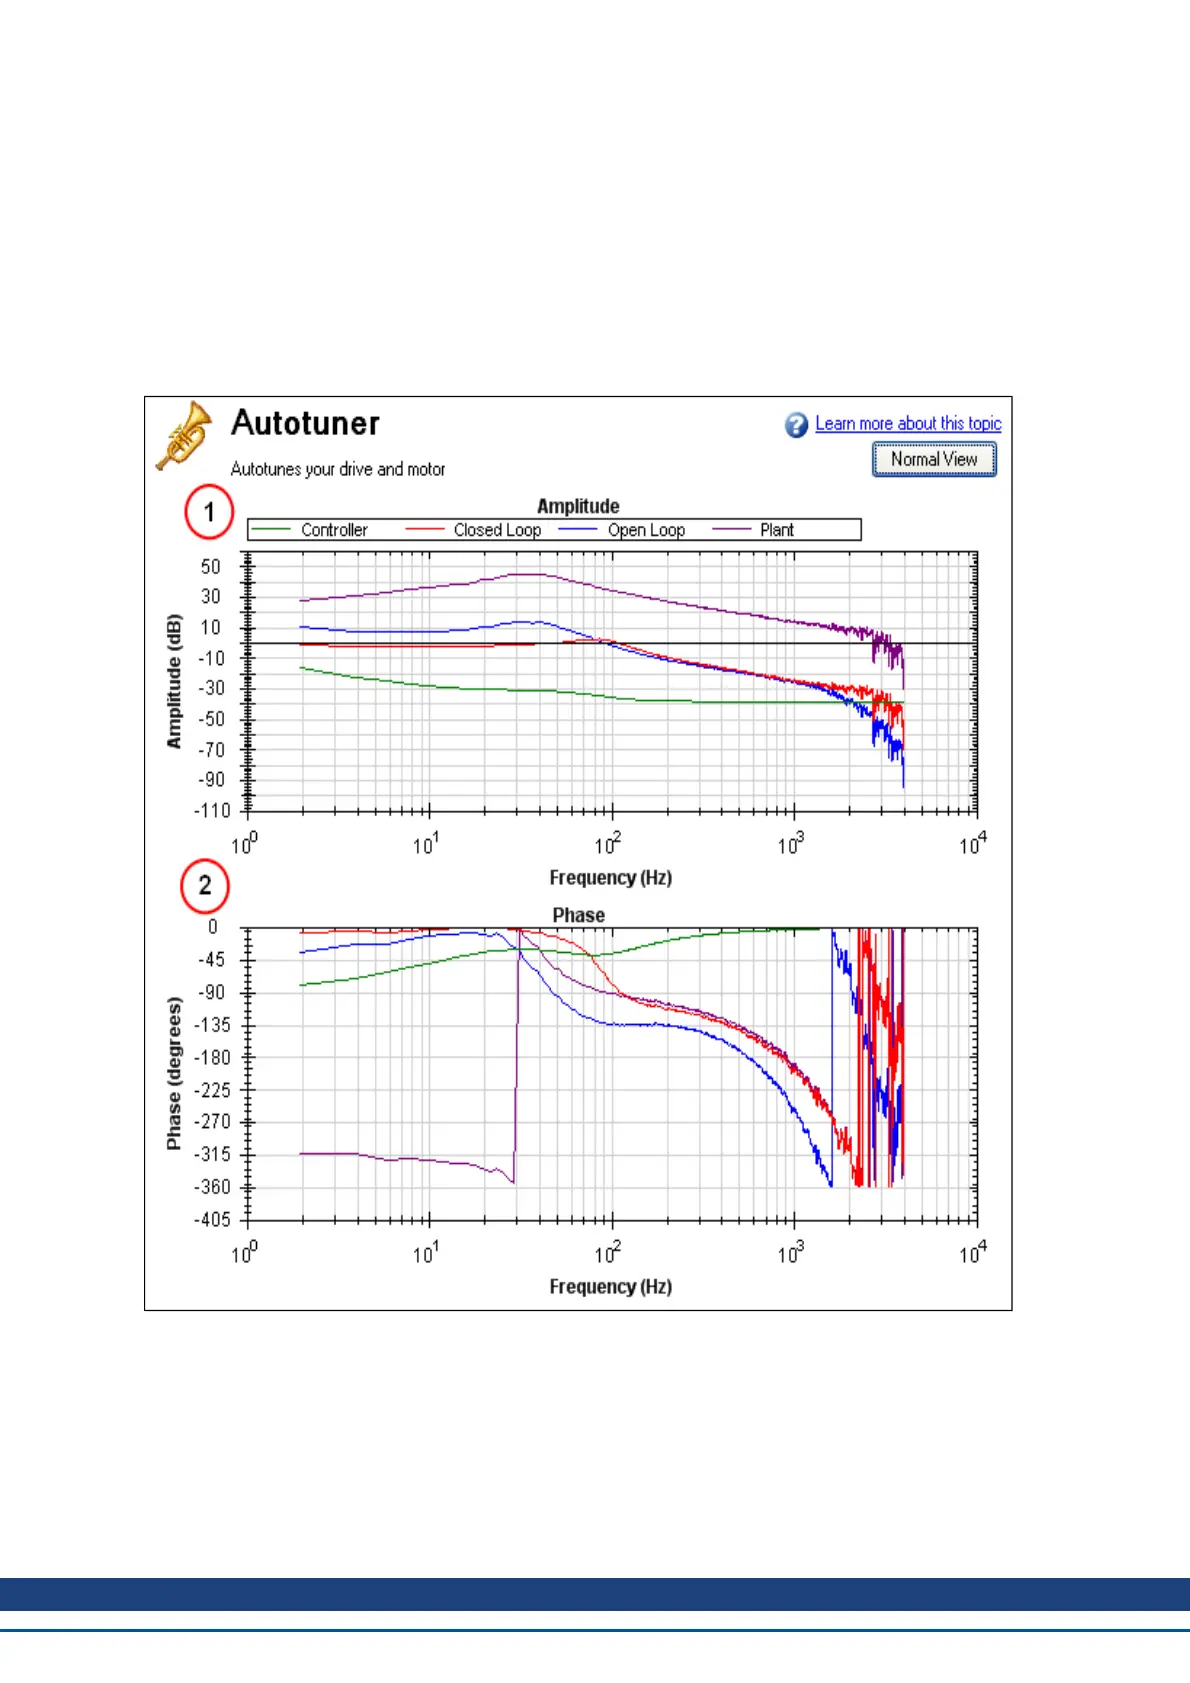
Below is a Bode plot of a motor with no load. The top plot is the magnitude plot (1); this plot shows the gain of the
system with respect to frequency. This plot is often used to determine the bandwidth of the servo system.
The lower plot is the phase plot (2). This plot is used in conjunction with the magnitude plot to determine stability,
and helps you to understand what kind of latencies exist in the servo system, or if latencies are induced by filters
in the velocity loop.
AKD User Guide | 14 Tuning Your System
Kollmorgen | December 2010 163
 Loading...