Send documentation comments to mdsfeedback-doc@cisco.com
58-2
Cisco MDS 9000 Family Fabric Manager Configuration Guide
OL-17256-03, Cisco MDS NX-OS Release 4.x
Chapter 58 Performance Monitoring
Real-Time Performance Monitoring
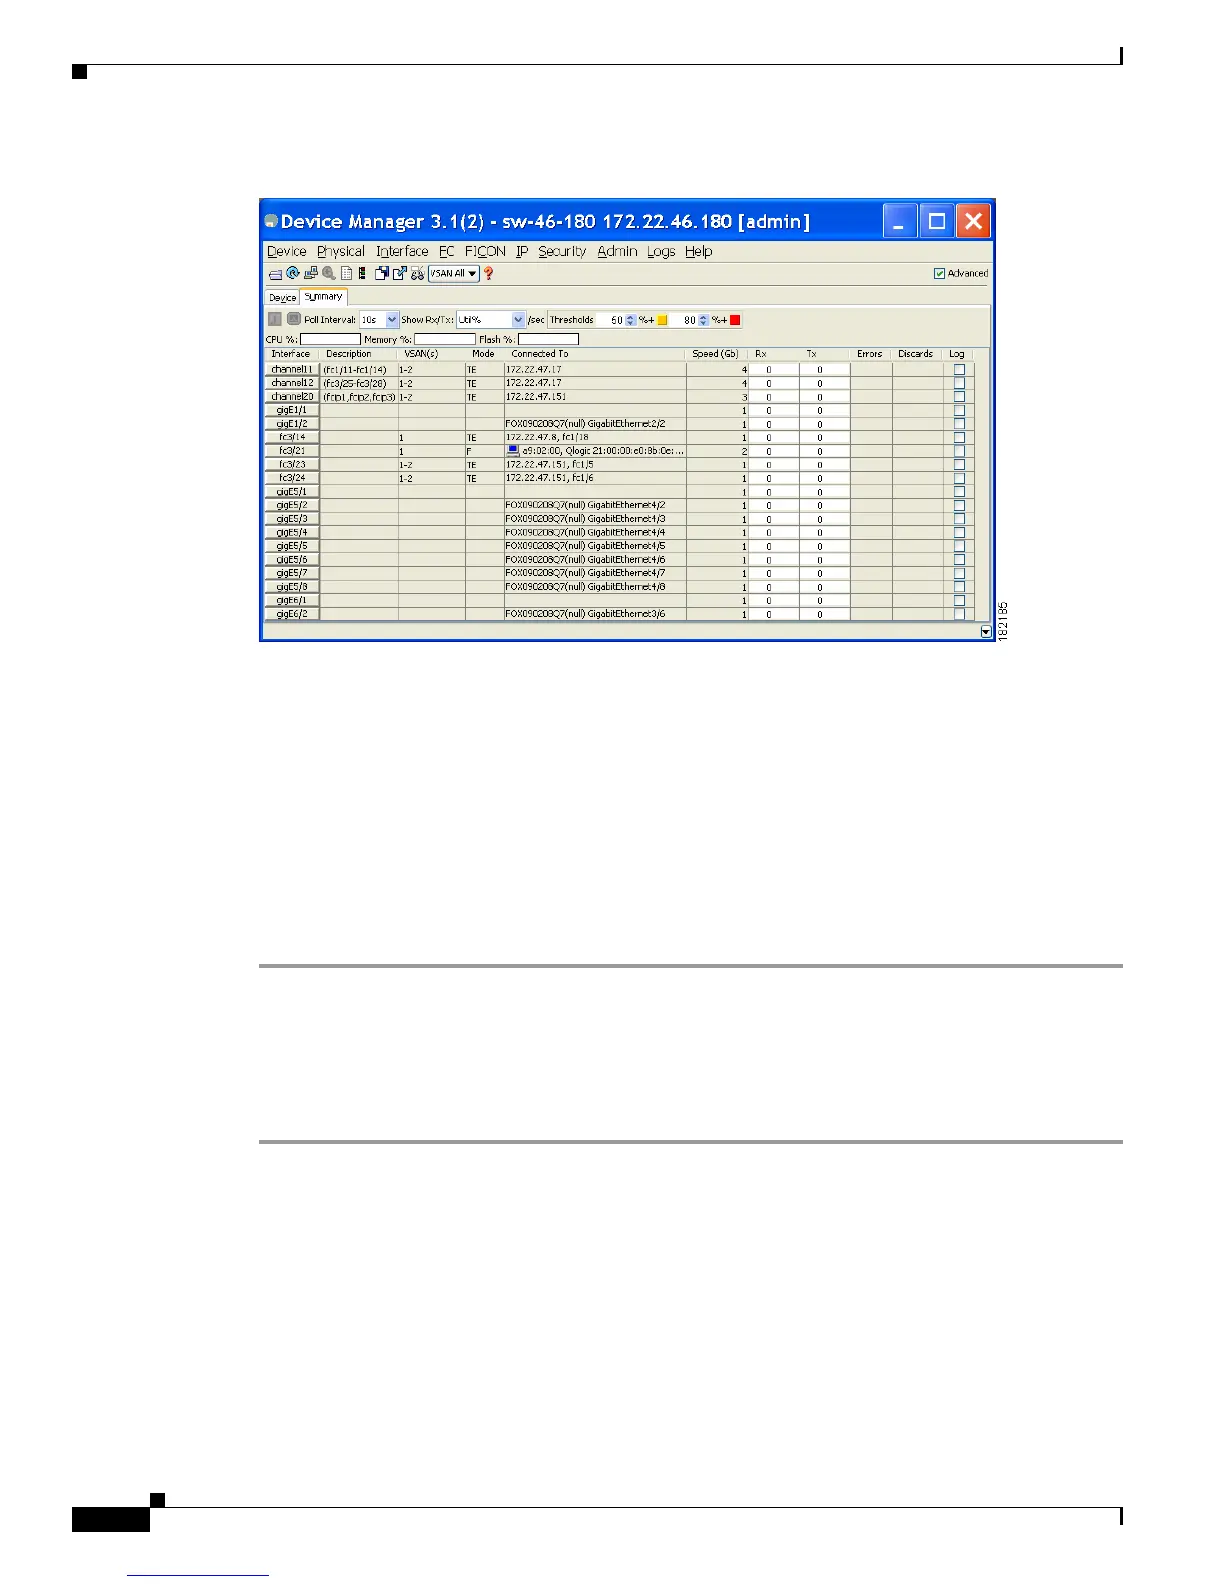
Figure 58-1 Device Manager Summary Tab
Step 2 Select a value from the Poll Interval drop-down list.
Step 3 Decide how you want your data to be interpreted by looking at the Show Rx/Tx drop-down menu. The
table updates each polling interval to show an overview of the receive and transmit data for each active
port on the switch.
Step 4 Select a value from the Show Rx/Tx drop-down list. If you select Util%, you need to also select values
from the two Show Rx/Tx > %Util/sec drop-down lists. The first value is the warning level and the
second value is the critical threshold level for event reporting.
Note that you can also display percent utilization for a single port by selecting the port and clicking the
Monitor Selected Interface Traffic Util % icon.
Step 5 Click the Save Configuration icon.
The configurable monitor per port option gives statistics for in and out traffic on that port, errors, class
2 traffic and other data that can be graphed over a period of time to give a real-time view into the
performance of the port.
To configure per port monitoring using Device Manager, follow these steps:
Step 1 Click the Device tab.
Step 2 Right-click the port you are interested in and choose Monitor from the drop-down menu.
You see the port real-time monitor dialog box shown in Figure 58-2.
 Loading...