Send documentation comments to mdsfeedback-doc@cisco.com
7-26
Cisco MDS 9000 Family Fabric Manager Configuration Guide
OL-17256-03, Cisco MDS NX-OS Release 4.x
Chapter 7 Fabric Manager Web Client
Performance
• Threshold—80%
• SAN elements or links—ISLs
• Performance prediction type—Average
Click a link in the Name column to view a graph of that ISL’s performance for the past 24 hours. To view
the performance for the past week, month, year, or custom time, select an option from the drop-down list.
Using Your Own Values
To view a table of predicted future performance with your own values using Fabric Manager Web Client,
follow these steps:
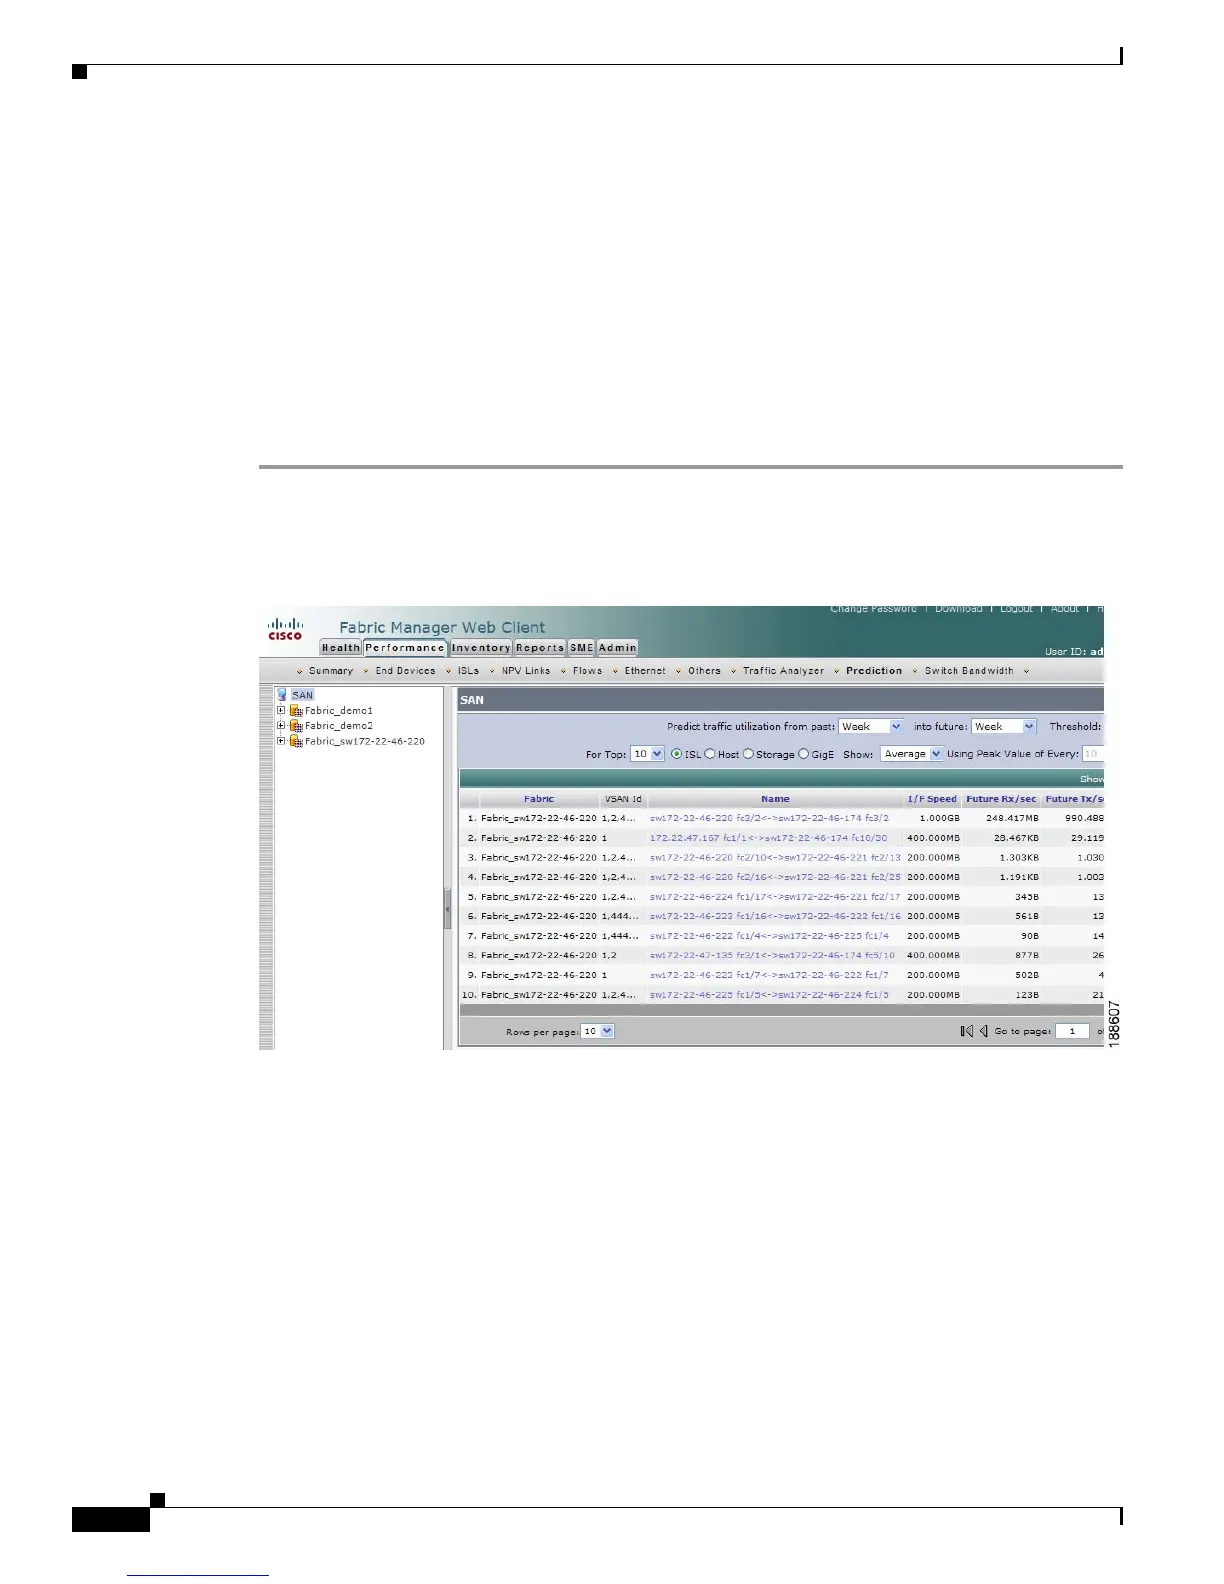
Step 1 Click the Performance tab, and then click Prediction.
You see the Prediction tab window as shown in Figure 7-19.
Figure 7-19 Prediction Tab
Step 2 Expand a fabric and select one of the VSANs to specify that the prediction report will be generated for
that VSAN.
Step 3 Select the period of time (Week, Month, 3 Months, 6 Months or Year) to use to predict performance from
the past drop-down list.
Step 4 Select the period of time (Week, Month, 3 Months, 6 Months or Year) for which to make the prediction
from the future drop-down list.
Step 5 Enter the threshold percentage (1—100) of utilization that you do not want the traffic to exceed.
Step 6 Enter the number of ISLs, hosts, storage devices, or flows for which you want to make the prediction.
The prediction will show the top 10, top 20, or top 50 with the most traffic.
Step 7 Select the type of traffic prediction to show:
• Average—The average value of all the sample data is used.
 Loading...