Send documentation comments to mdsfeedback-doc@cisco.com
7-10
Cisco MDS 9000 Family Fabric Manager Configuration Guide
OL-17256-03, Cisco MDS NX-OS Release 4.x
Chapter 7 Fabric Manager Web Client
Health
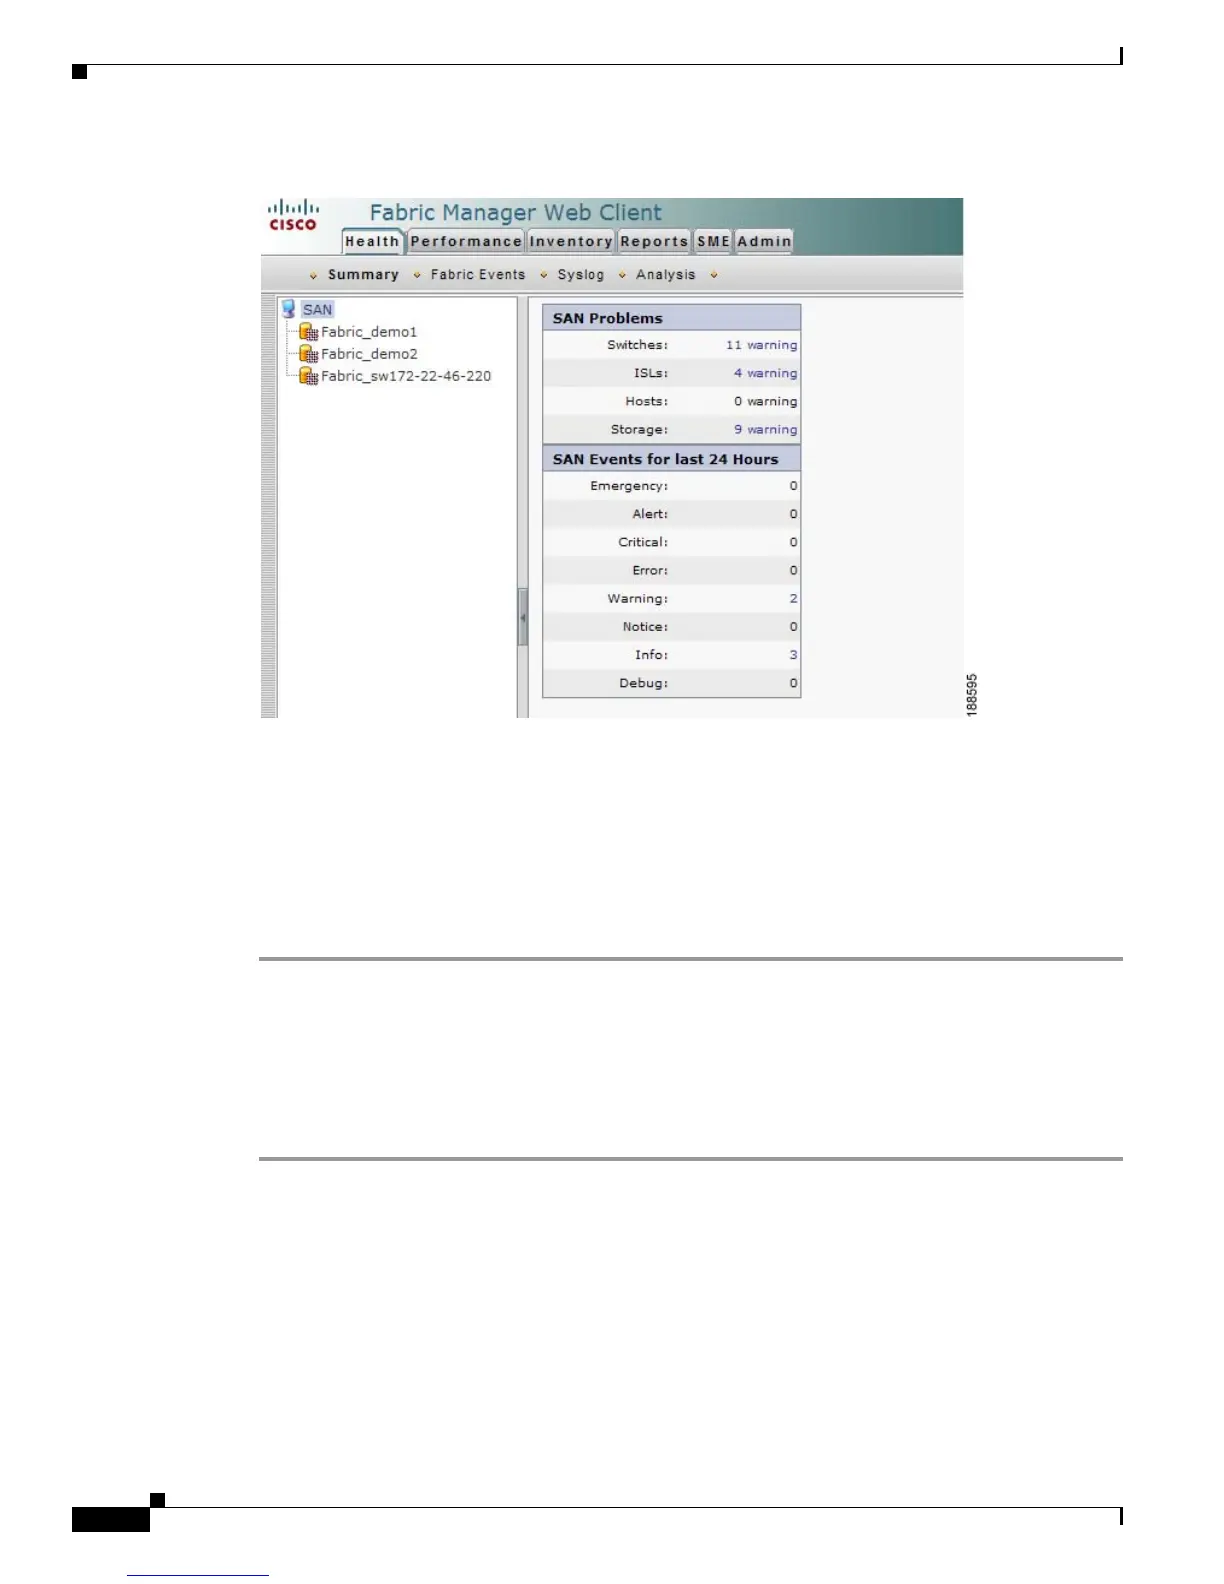
Figure 7-3 Summary Tab
Step 2
Do one of the following:
• Choose SAN to display summary information for all fabrics.
• Choose one of the fabrics to display summary information for that fabric.
Step 3 Click the warnings next to Switches, ISLs, Hosts, or Storage (other than 0) to see an inventory of
switches, ISLs, or end devices for that fabric.
Step 4 Choose the number of events next to the event severity levels (Emergency, Alert, Critical, Error,
Warning, Notice, Info, or Debug) to see a table of events and descriptions for that fabric.
Viewing Fabric Information
To view a detailed list of events and hardware or accounting using Fabric Manager Web Client, follow
these steps:
Step 1 Click the Health tab, and then click Fabric Events tab.
You see the Fabric tab window as shown in Figure 7-4.
 Loading...