Send documentation comments to mdsfeedback-doc@cisco.com
7-13
Cisco MDS 9000 Family Fabric Manager Configuration Guide
OL-17256-03, Cisco MDS NX-OS Release 4.x
Chapter 7 Fabric Manager Web Client
Performance
• Switch Health—The switch health report provides status information on all critical Cisco MDS
9000 system, module, port, and Fibre Channel services.
• Fabric Configuration—The fabric configuration analysis compares multiple switches to a specific
switch or a saved configuration.
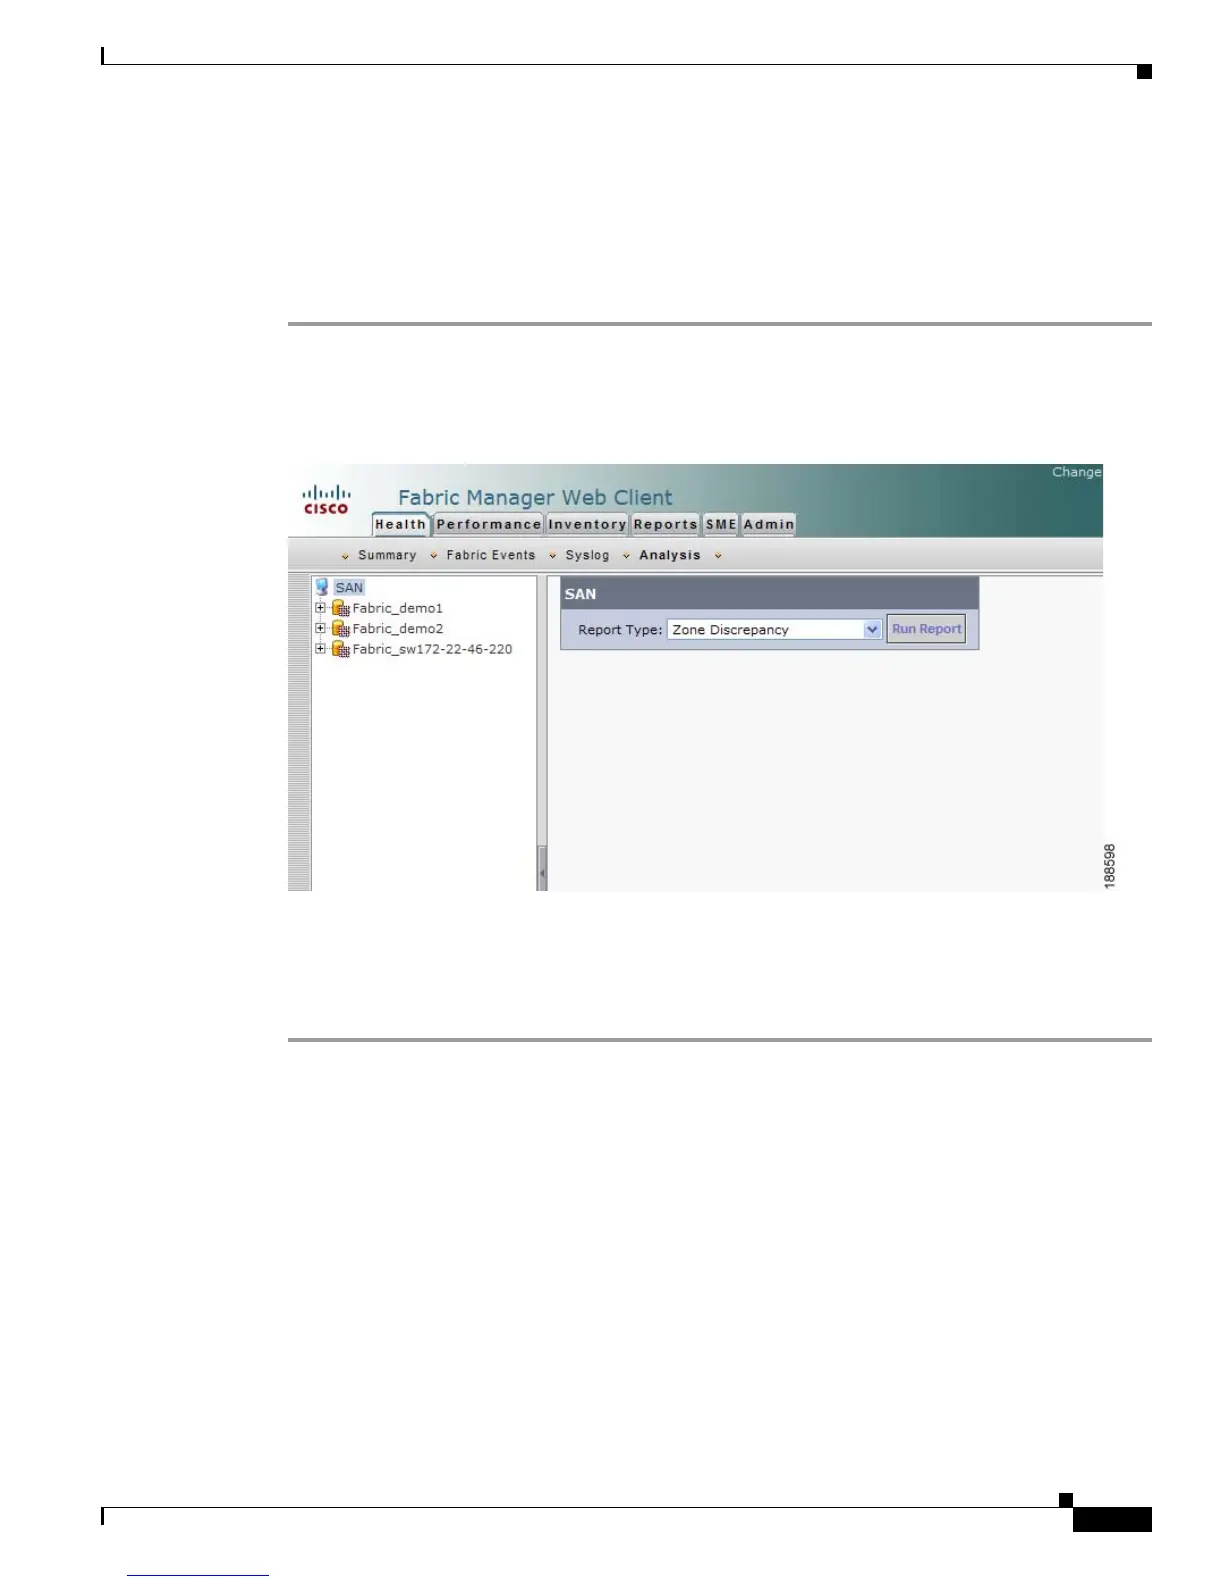
To run analysis reports using Fabric Manager Web Client, follow these steps:
Step 1 Click the Health tab, and then click Analysis tab.
You see the Analysis tab shown in Figure 7-6.
Figure 7-6 Analysis Tab
Step 2
Select a report from the Report Type drop-down list.
Step 3 Click Run Report to run the report.
To schedule a report to run at a specified time, see “Generating Custom Reports by Template” section
on page 7-40.
Performance
The Performance tab shows an overview of the average throughput and link utilization of SAN
components. You see pie charts for the throughput and utilization. You can click a pie chart to view a
table of the data. In these tables, clicking a blue link displays a graph of that data, if applicable. The
Filter drop-down list at the top right of the screen allows you to filter the data based on various periods
of time.
The Performance tab contains the following subtabs:
• Summary—Shows the total utilization and throughput in summary form.
• End Devices—Shows a detailed list of end devices (host or storage), port traffic, and errors.
• ISLs—Shows a detailed list of ISL traffic and errors.

 Loading...