Send documentation comments to mdsfeedback-doc@cisco.com
7-22
Cisco MDS 9000 Family Fabric Manager Configuration Guide
OL-17256-03, Cisco MDS NX-OS Release 4.x
Chapter 7 Fabric Manager Web Client
Performance
Viewing Performance Information for Flows
To view host and storage traffic using Fabric Manager Web Client, follow these steps:
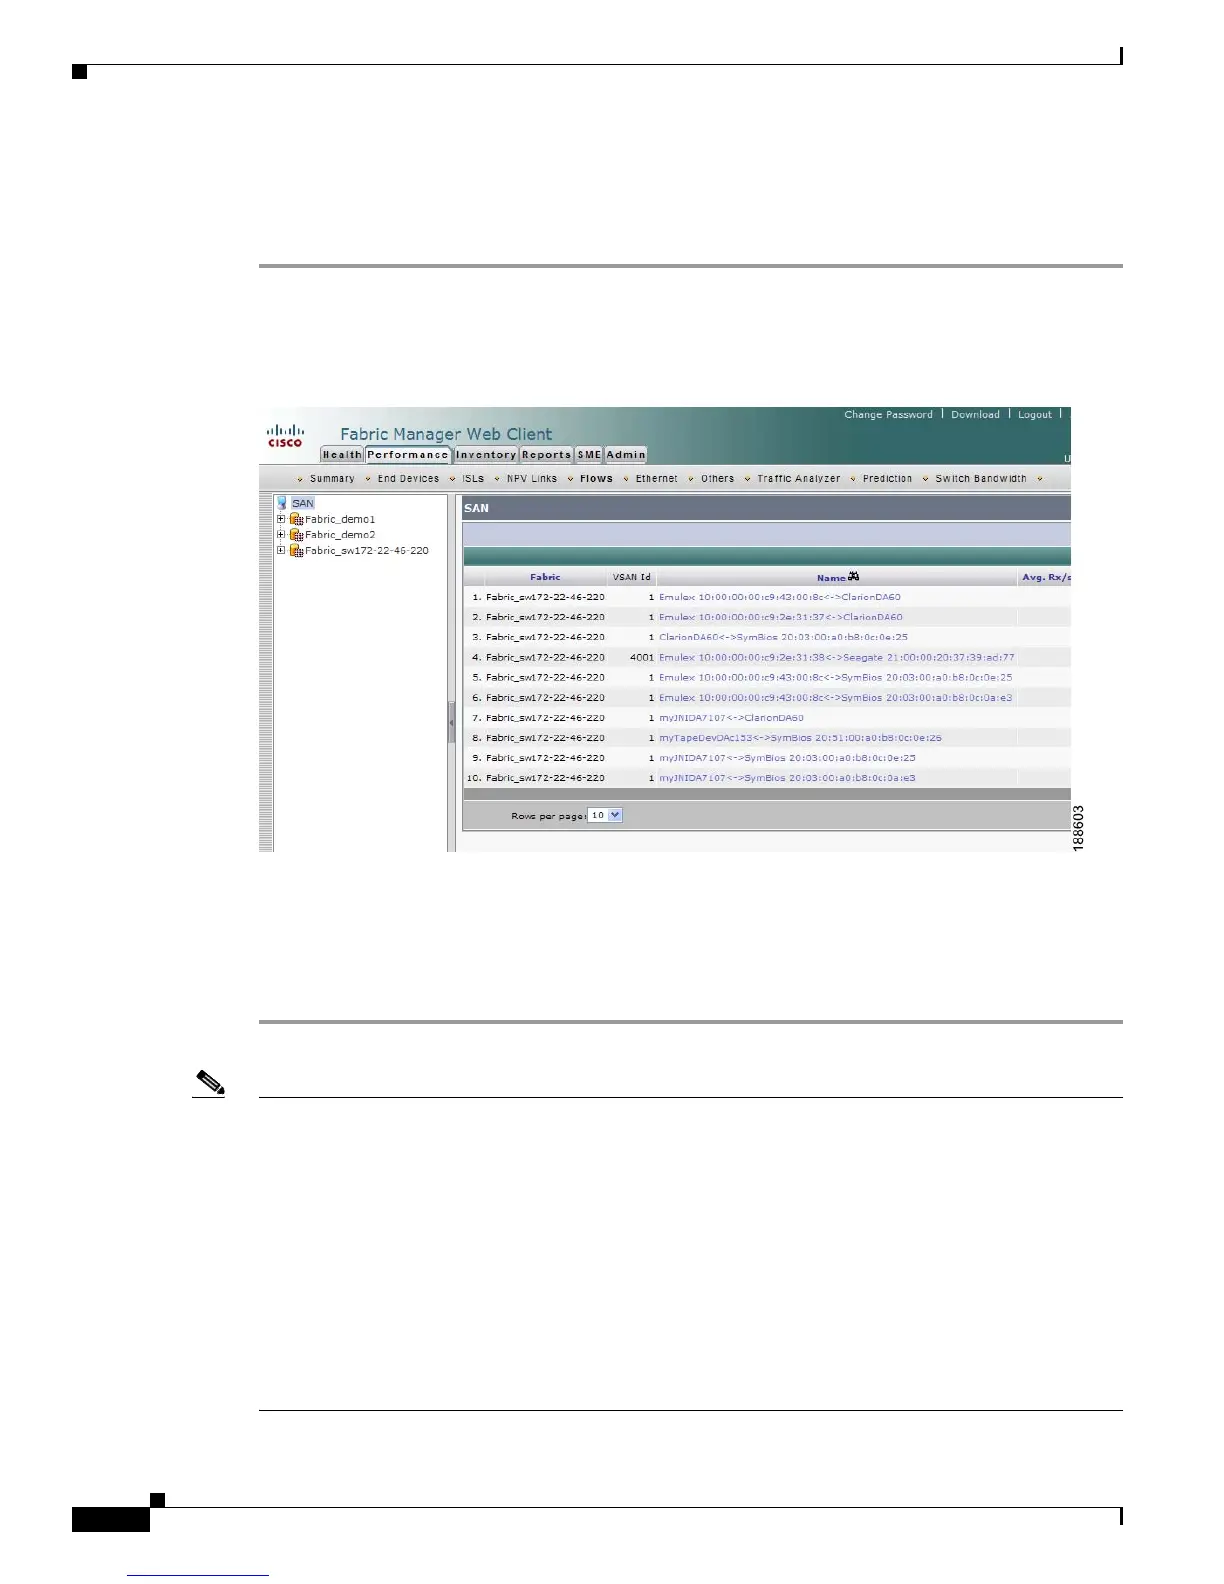
Step 1 Click the Performance tab, and then click Flows.
You see the Flows tab window as shown in Figure 7-15.
Figure 7-15 Flows Tab
Step 2
Expand a fabric and select one of the VSANs to display performance information for the flows in that
VSAN.
Step 3 Click the name of a flow from the Name column to see a list of the traffic for the past 24 hours.
Note There are variations to this procedure. In addition to these basic steps, you can also perform the
following steps to view detailed information for Flows:
• To change the time range for this graph, select it from the drop-down list in the upper right corner.
• To view the detailed information for specific period, drag the slider control to choose the time
interval for which you need the information.
• To view information in grid format, click the grid icon in the bottom right corner.
• To export the data into a spreadsheet, click the excel icon in the upper right corner and then click
Save.
• To view real time information, select Real Time from the drop-down list in the upper right corner.
Real time data is updated in every 10 seconds.
 Loading...