Send documentation comments to mdsfeedback-doc@cisco.com
7-24
Cisco MDS 9000 Family Fabric Manager Configuration Guide
OL-17256-03, Cisco MDS NX-OS Release 4.x
Chapter 7 Fabric Manager Web Client
Performance
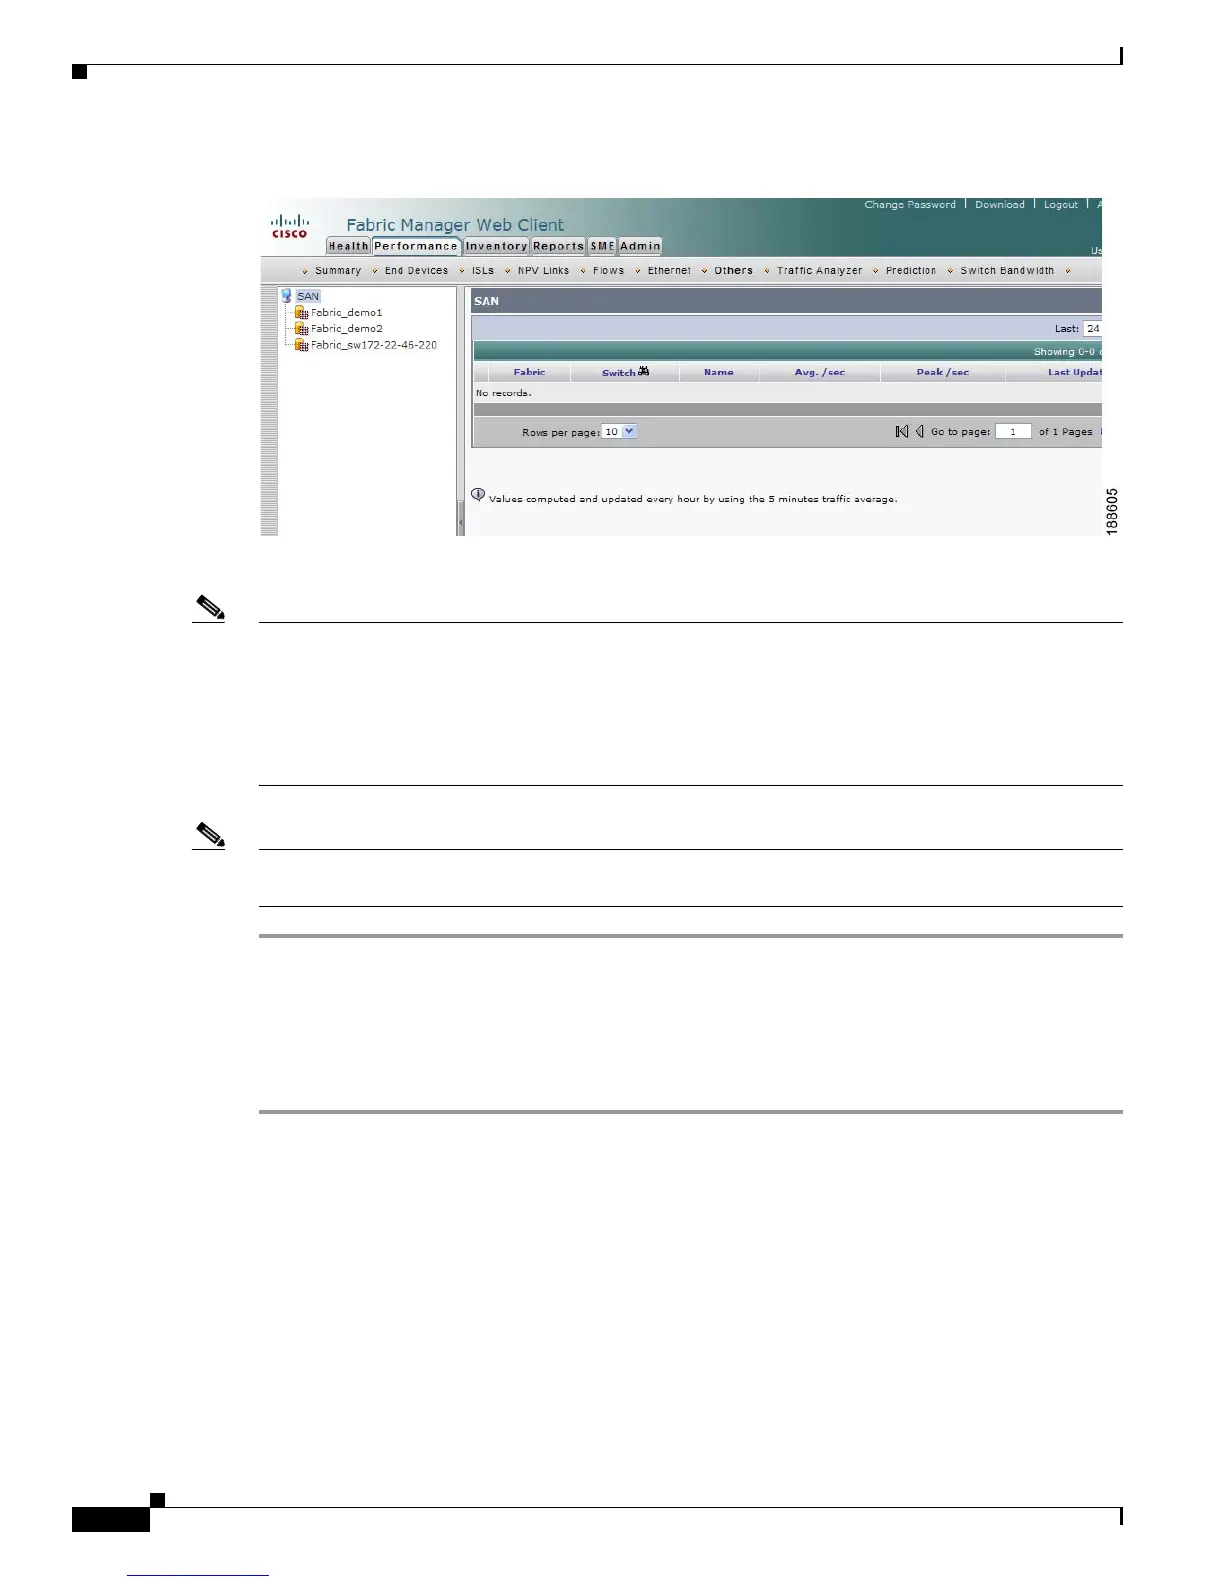
Figure 7-17 Others Tab
Step 2 Expand a fabric and select one of the VSANs to display the other statistics in that VSAN.
Note There are variations to this procedure. In addition to these basic steps, you can also:
• Select the time range, and click Filter to filter the display.
• Select the IP address of a switch from the Name column to see a graph of the traffic across that
switch for the past 24 hours. You can change the time range for this graph by selecting it from the
drop-down list in the upper right corner.
Note To configure Other Statistics, follow the instructions described in the “Configuring Other Statistics”
section on page 7-57.
Viewing Detailed Traffic Information
To view SPAN port detailed traffic using Fabric Manager Web Client, follow these steps:
Step 1 Click the Performance tab, and then click Traffic Analyzer.
You see the Traffic Analyzer tab window as shown in Figure 7-18.
 Loading...