Send documentation comments to mdsfeedback-doc@cisco.com
7-14
Cisco MDS 9000 Family Fabric Manager Configuration Guide
OL-17256-03, Cisco MDS NX-OS Release 4.x
Chapter 7 Fabric Manager Web Client
Performance
• NPV Links— Shows a detailed list of traffic between NPV devices and ports.
• Flows—Shows a detailed list of host-to-storage traffic.
• Ethernet—Shows a detailed list of GigE ports.
• Others—Shows a detailed list of other statistics.
• Traffic Analyzer—Shows a summary of SPAN ports configured in the SAN and any traffic
analyzers configured.
• Prediction—Displays a graph that predicts future performance to help determine when storage
network connections will become overutilized.
• Switch Bandwidth—Shows total bandwidth for a switch.
Viewing Performance Summary Information
To view total utilization and throughput in summary form using Fabric Manager Web Client, follow
these steps:
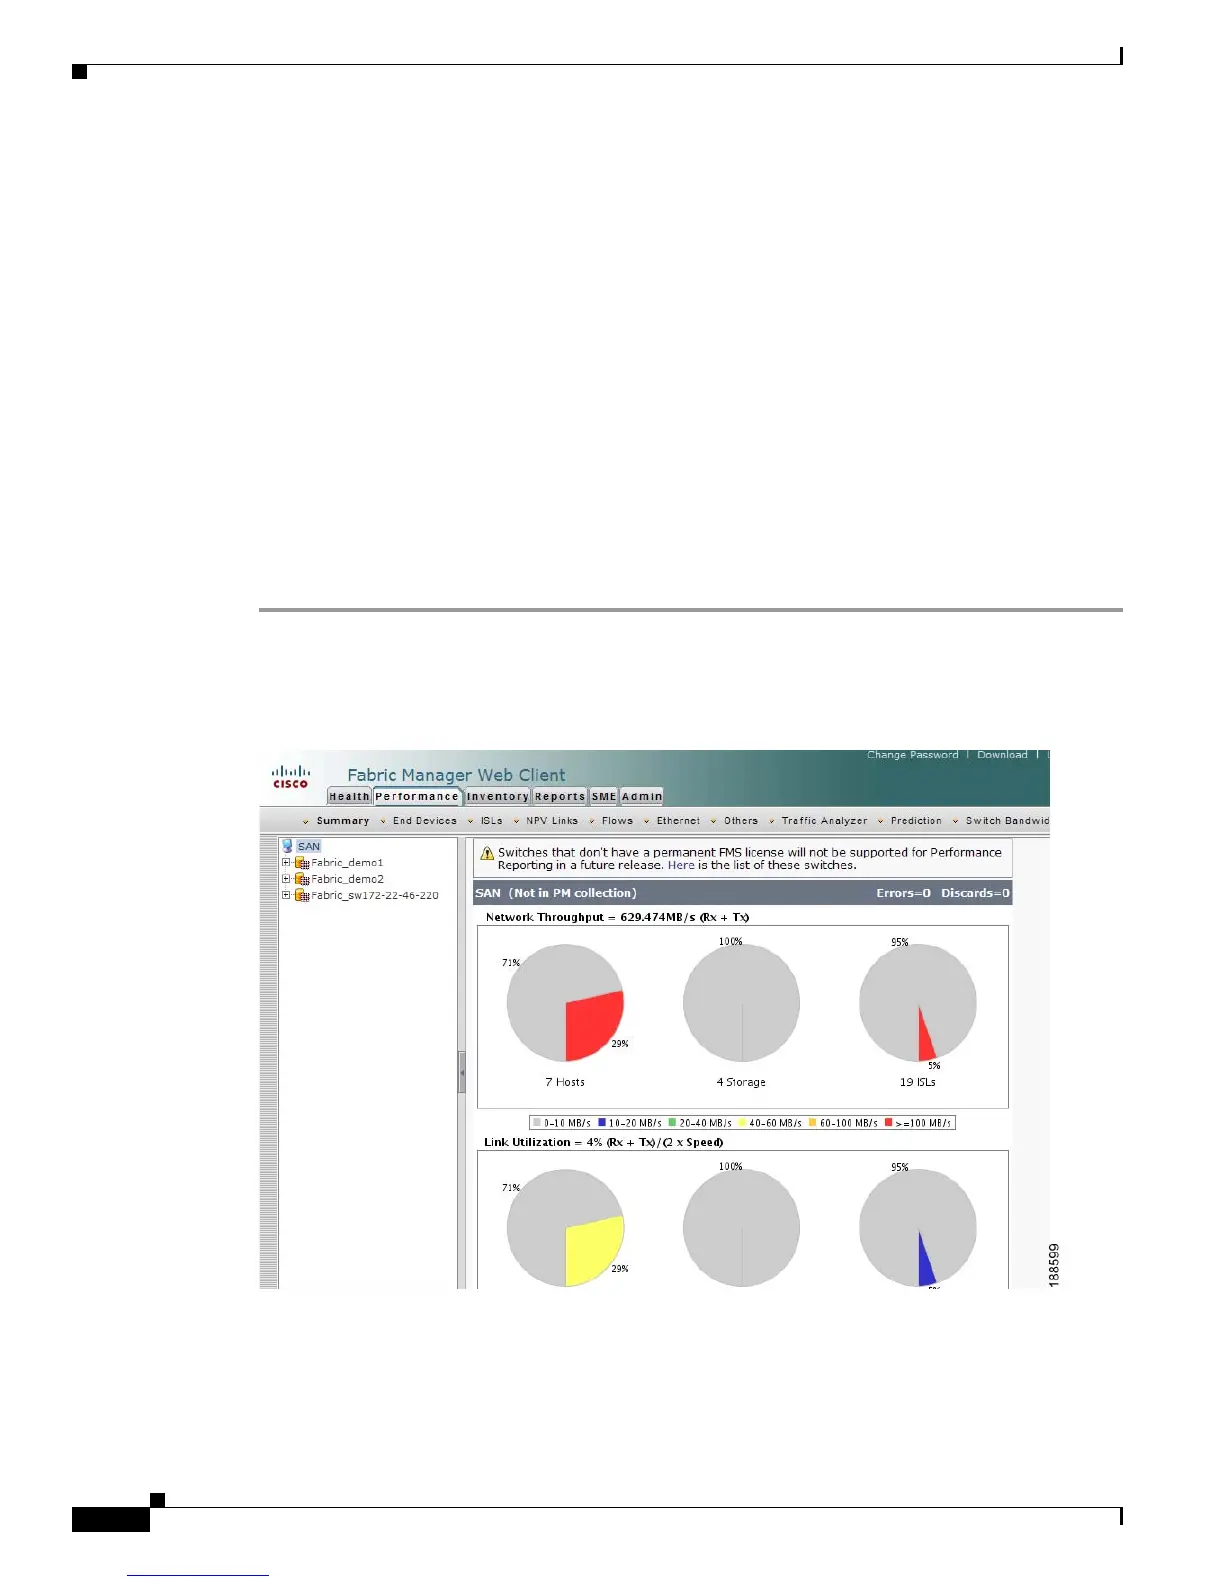
Step 1 Click the Performance tab, and then click Summary tab.
You see the Summary tab shown in Figure 7-7.
Figure 7-7 Summary Tab
Step 2
Expand a fabric and select one of the VSANs to display network throughput and link utilization
information for that VSAN.
 Loading...