Power analysis (option R&S RTE-K31)
R&S
®
RTE
977User Manual 1326.1032.02 ─ 20
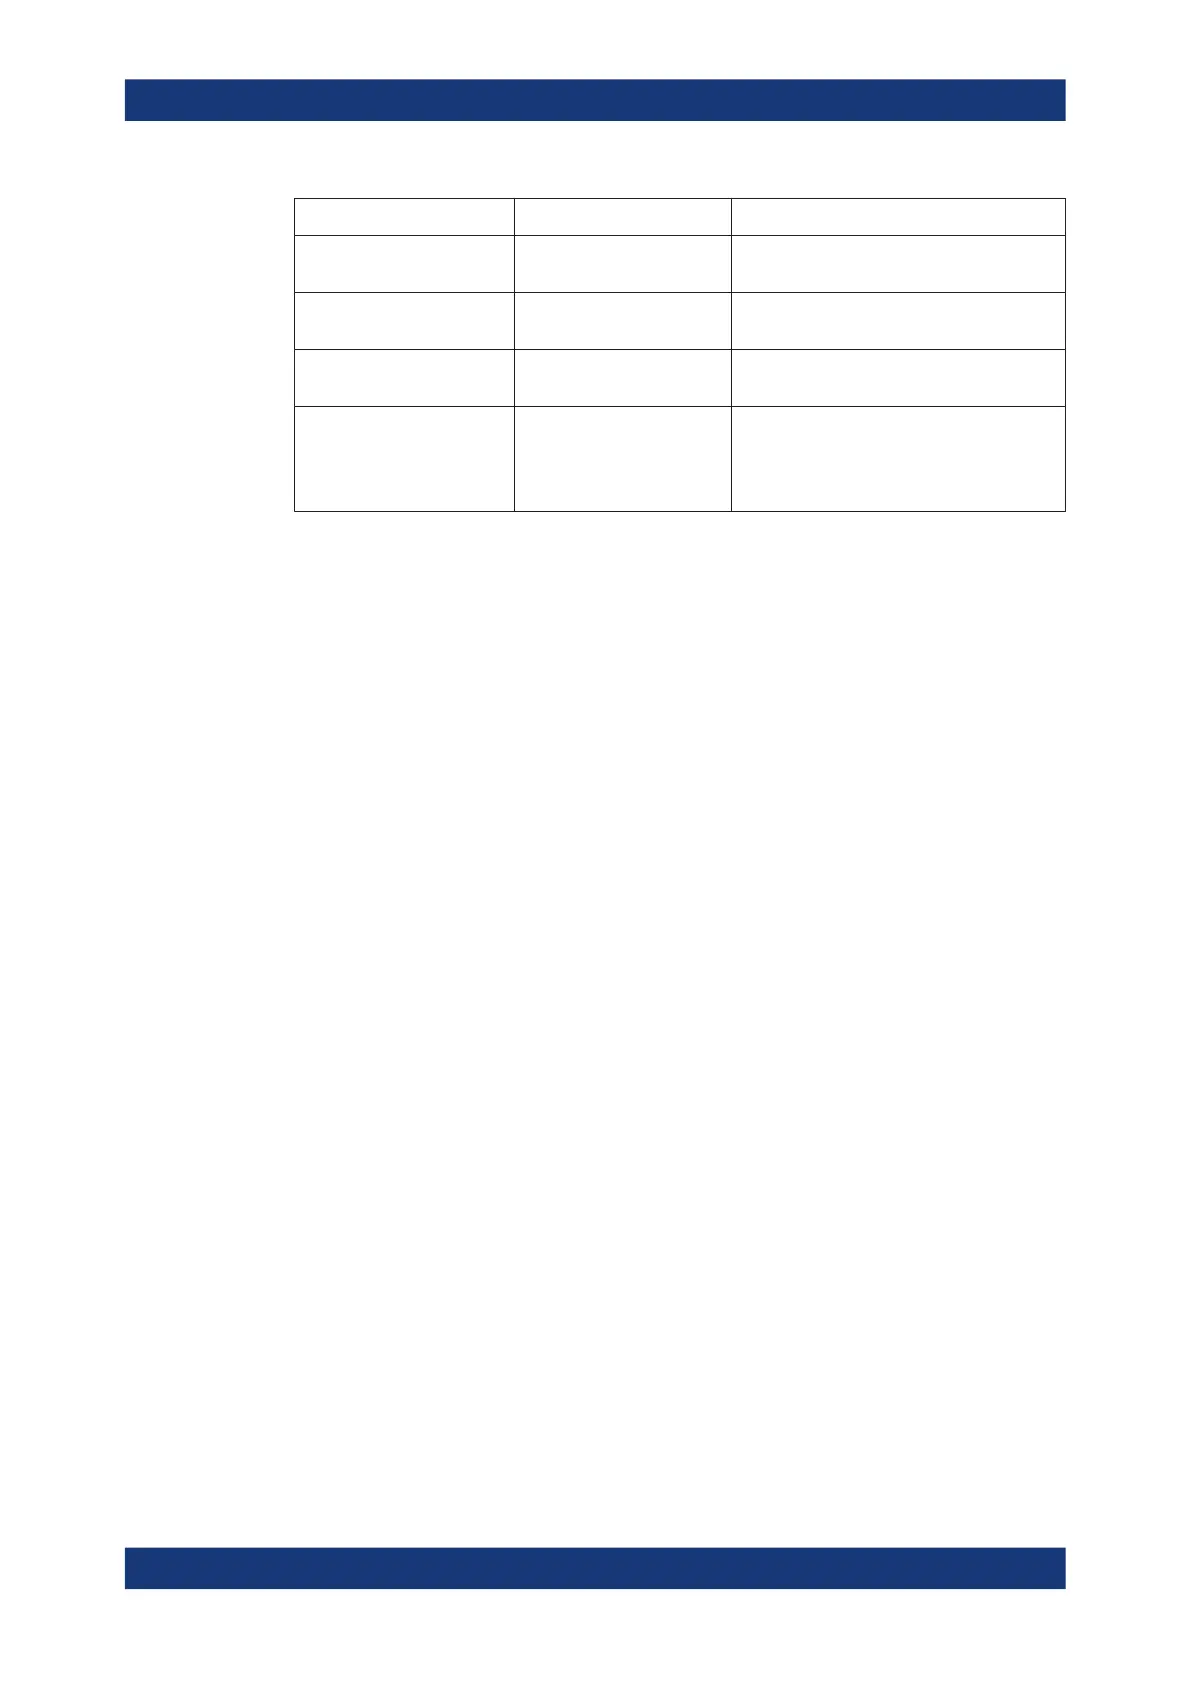
Result Table Bar Chart Match Description
Value Value of the Y-Axis. Shown
by a green bar
The present value of the current harmonic
Maximum Shown by a darkened green
bar
The maximum measured value
Standard limit Shown by a white bar The maxim allowed value according to the
selected standard
"Y max" "Y max" Sets the upper limit for the display of the Y
scale.
This value can be reset with the "Reset Max"
button
The following remote commands are used for handling the measurement results:
●
POWer:HARMonics:RESult<m>:FREQuency<n>:VALue? on page 1956
●
POWer:HARMonics:RESult<m>:MAXValue<n>:VALue? on page 1956
●
POWer:HARMonics:RESult<m>:STDinuse? on page 1956
●
POWer:HARMonics:RESult<m>:STDValue<n>:VALue? on page 1956
●
POWer:HARMonics:RESult<m>:VALue<n>:VALue? on page 1956
●
POWer:HARMonics:REPort:ADD on page 1956
16.3.3.2 Configuring current harmonic
For details of the configuration settings, see Chapter 16.3.3.3, "Current harmonic set-
tings", on page 978.
1. Select "Analysis">"Power".
2. Under "Power Analysis", select "Current Harmonic".
3. Connect the differential voltage probe and the current probe to the oscilloscope.
4. Deskew the probes as described in Chapter 16.1.1.1, "Auto deskew", on page 955.
5. Connect the probes to the DUT as shown in the "Channels" tab:
Input

 Loading...


