Measurements
R&S
®
RTE
373User Manual 1326.1032.02 ─ 20
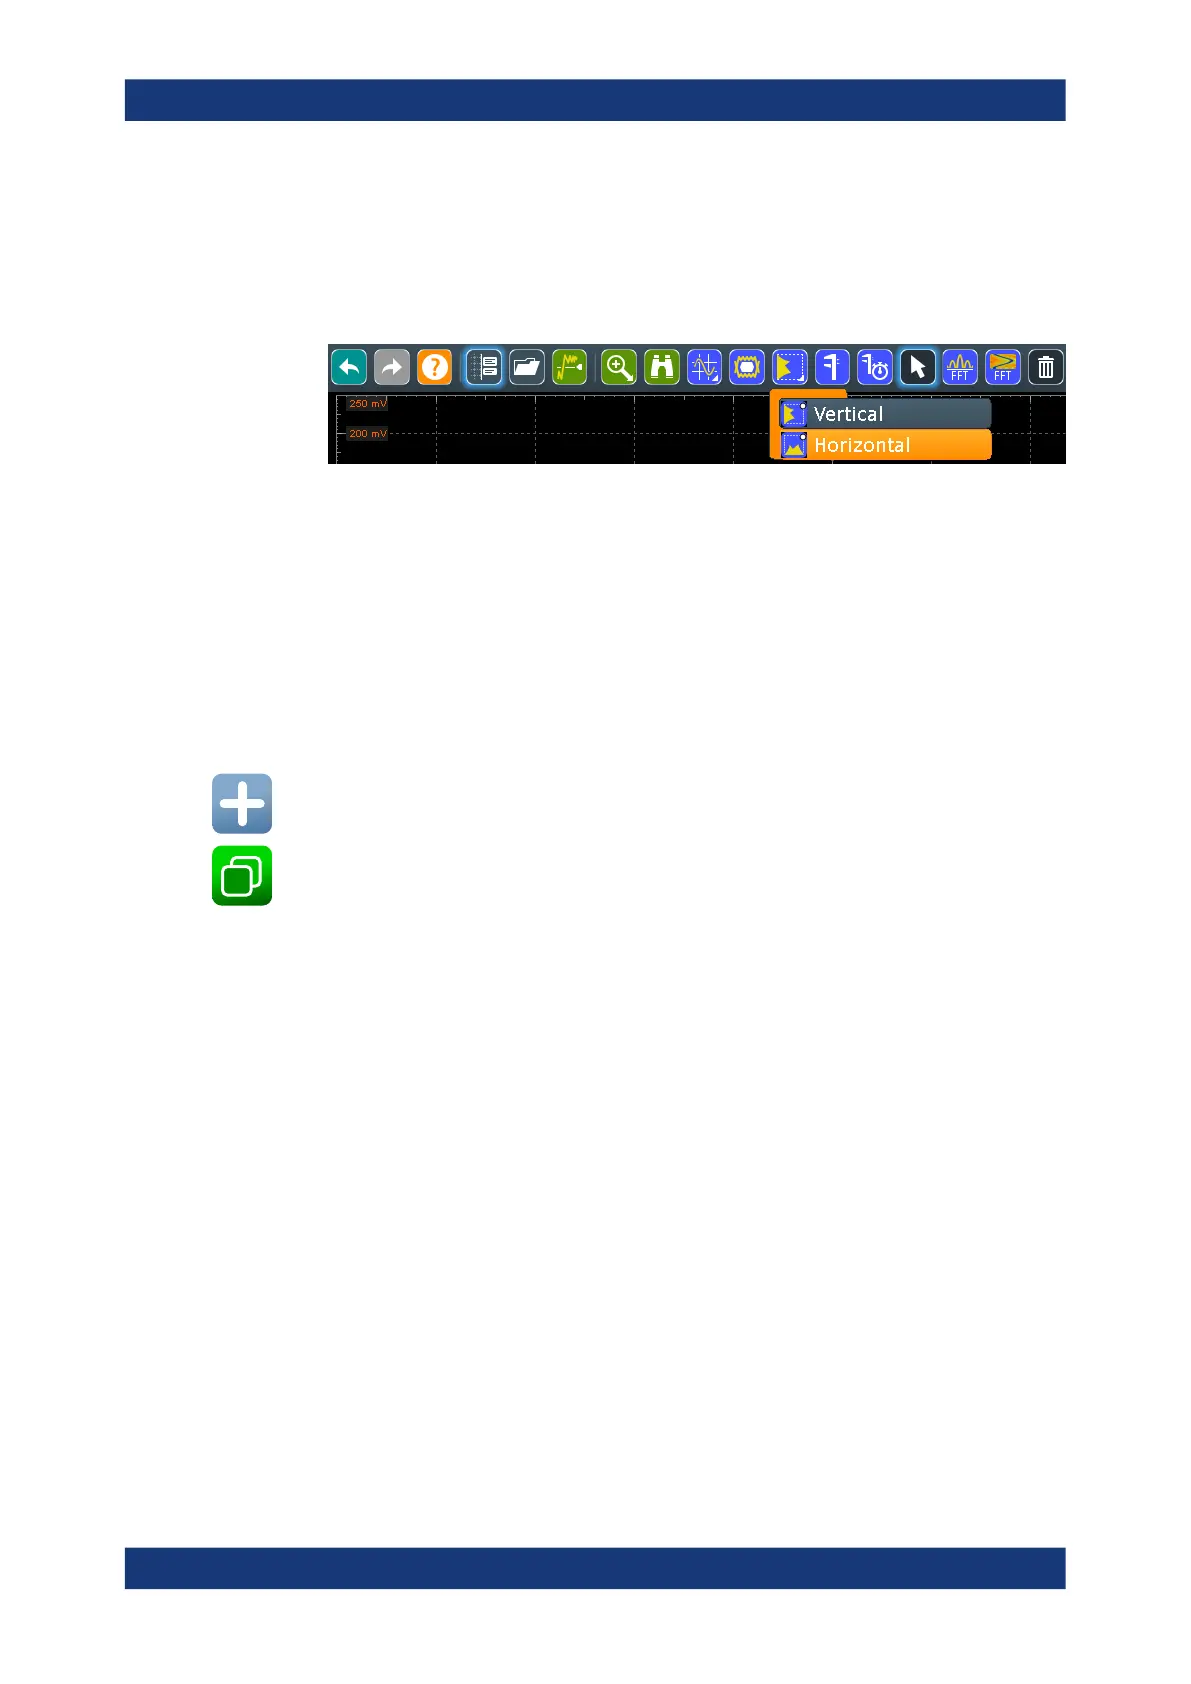
To create a histogram quickly with toolbar icons
1. Select the waveform for which you need a histogram.
2. Touch the histogram icon on the toolbar, and drag your finger down. Tap the "Verti-
cal histogram" or the "Horizontal histogram" icon.
3. Tap the diagram with the waveform to be measured, or draw a rectangle on the
screen to define the area for histogram calculation.
The histogram range is indicated in the diagram and a histogram with the selected
waveform as a source is defined and displayed.
To create and configure a histogram in the dialog box
1. Select "Meas" > " Histogram", or touch and hold an existing histogram or histogram
area.
The "Histogram Setup" dialog box is displayed.
2. To create a histogram, tap the "Add" icon in the upper right corner of the dialog
box.
3. To copy an existing histogram and configure a new one based on those settings,
tap the "Copy" icon.
4. To change the name of a histogram, double-tap the tab label. Enter a name for the
histogram using the on-screen keyboard.
5. Select a "Source" for the histogram. The source can be any input signal, math or
reference waveform.
6. Define the histogram "Mode": vertical for an amplitude, horizontal for a time-based
histogram.
7. Define the range of the waveform for which the histogram is to be generated. Enter
the start value and the stop value in x and in y direction, either as absolute or rela-
tive values.
8. Enable the histogram.
8.2.8.4 Histogram setup
Access: "Meas" menu > "Histogram"
In this dialog box, you configure histograms on which you can perform further mea-
surements.
Automatic measurements

 Loading...


