3 Spectrum Analyzer Mode
3.9 SEM Measurement
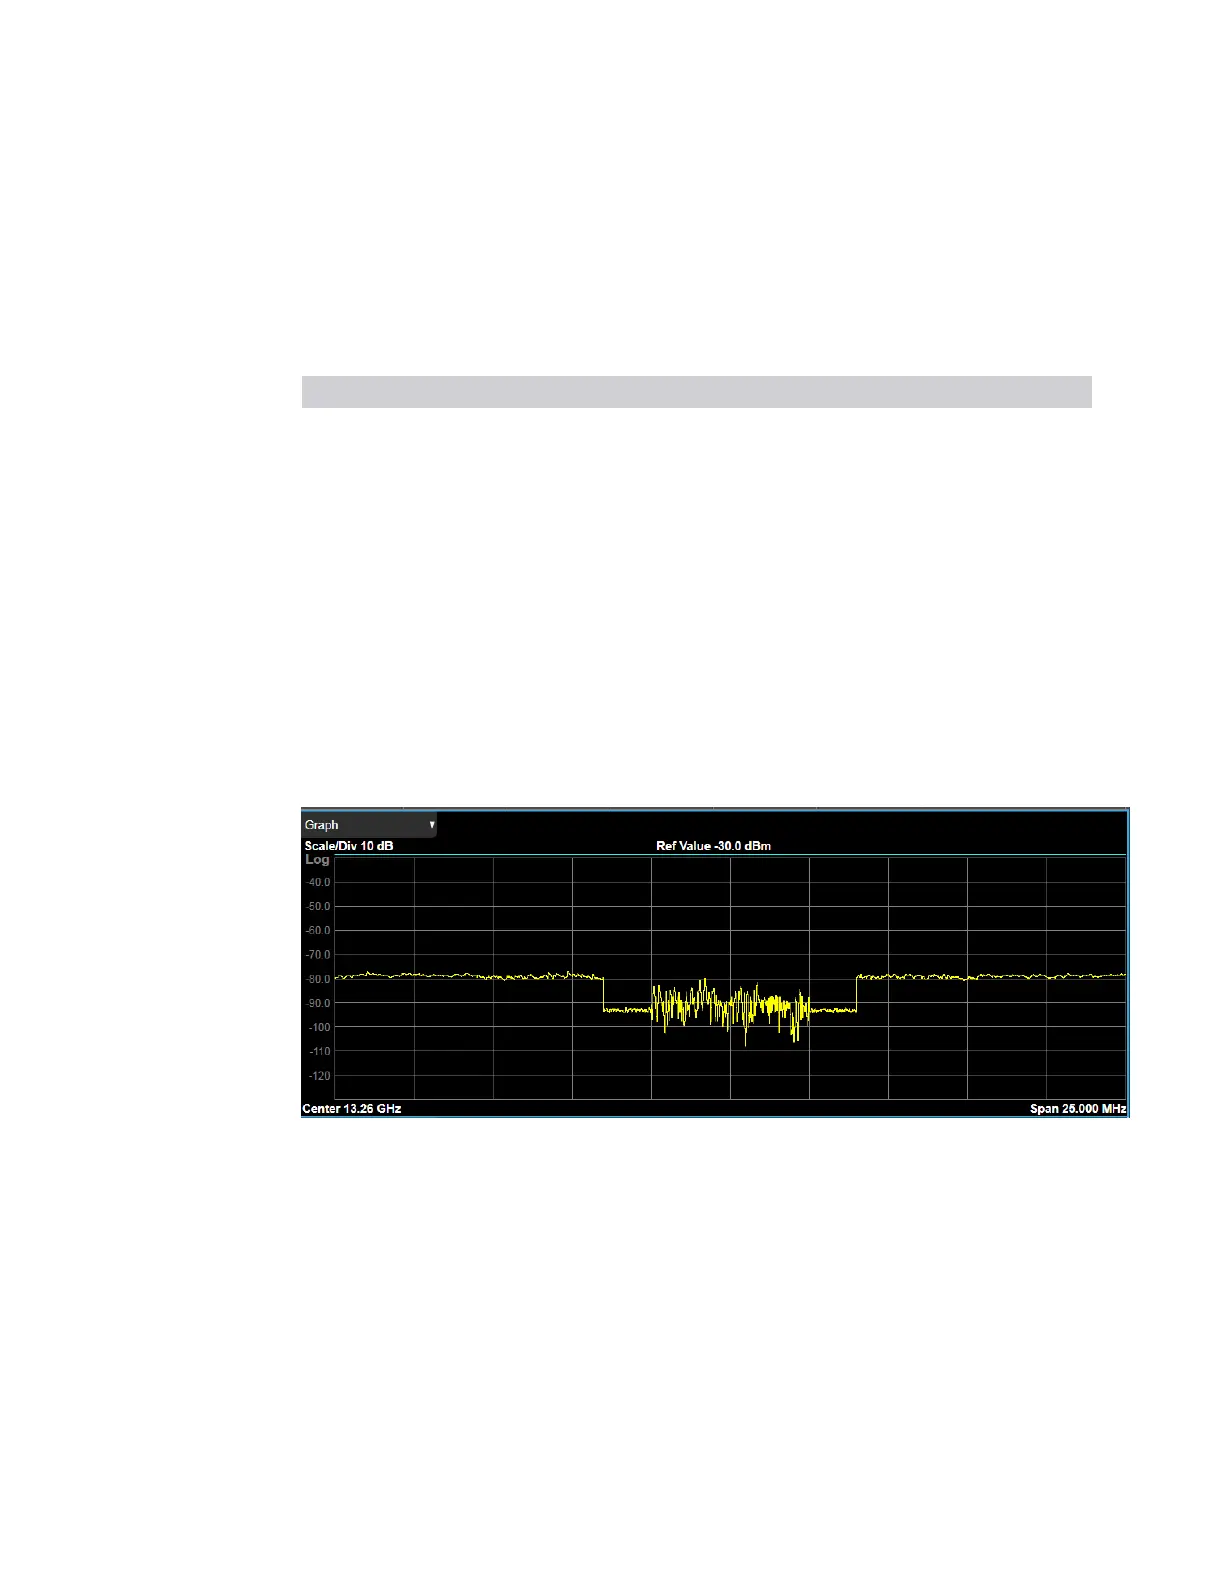
3.9.12.1 Graph
Used to display the spectrum being measured by the SEM measurement.
This window appears in several Views, as follows:
View Size Position
Abs Pwr Freq Three fifth, full width Top
Rel Pwr Freq Three fifth, full width Top
Integrated Power Three fifth, full width Top
Gate View One third, full width Middle
The Graph differs depending on which View you are in. The views differ depending
on the setting of the measurement type ("Measurement Type" on page 1700) under
the Meas Setup menu
Graph Window in Abs Pwr Freq View
Corresponding Trace yellow - Combined trace from carrier and each offset
Abs Peak Pwr & Freq (Total Pwr Ref)
Abs Peak Pwr & Freq (PSD Ref)
Spectrum Analyzer Mode User's &Programmer's Reference 1539
 Loading...


