3 Spectrum Analyzer Mode
3.2 Swept SA Measurement
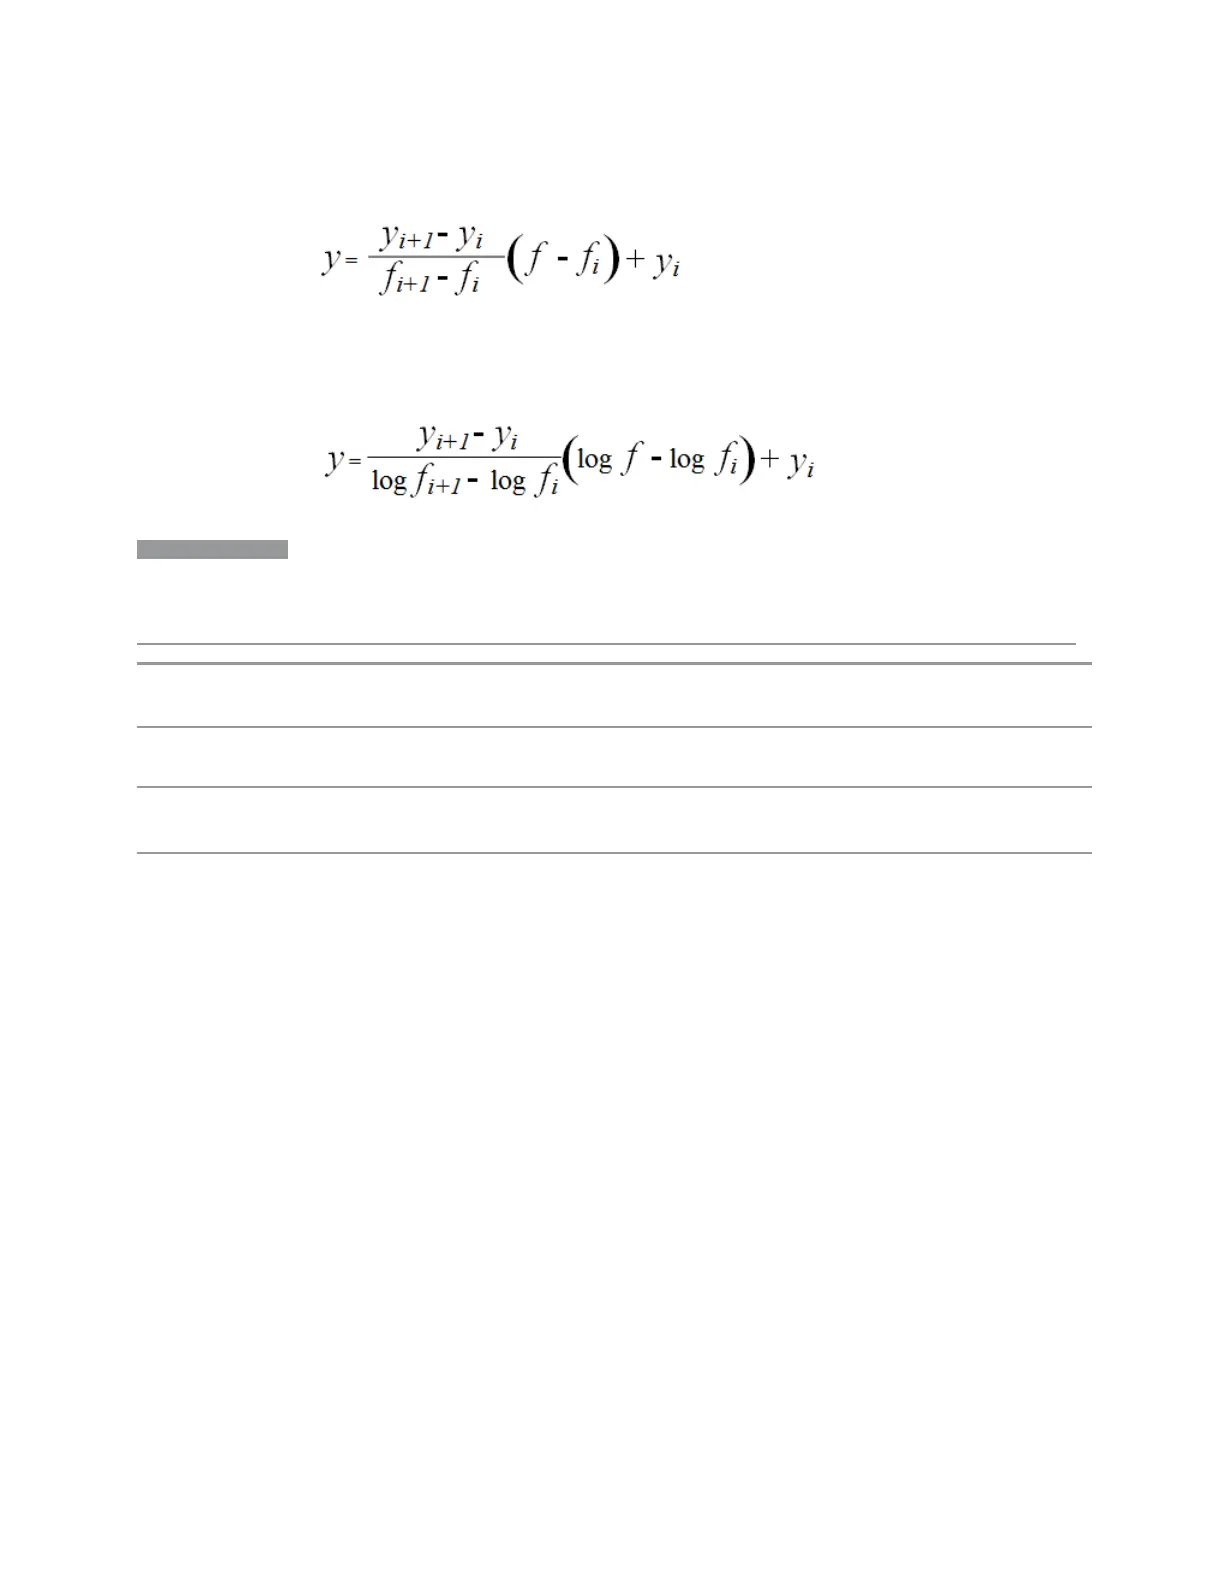
For log amplitude interpolation and log frequency interpolation, the interpolation is
computed as:
NOTE
Interpolation modes determine how limit values are computed between points in
the limit table. The appearance of a limit trace is also affected by the amplitude
scale, which may be linear or logarithmic.
Remote
Command
:CALCulate:LLINe[1]|2|…|6:CONTrol:INTerpolate:TYPE LOGarithmic | LINear
:CALCulate:LLINe[1]|2|…|6:CONTrol:INTerpolate:TYPE?
Example Set Limit Line 1 frequency interpolation to linear:
:CALC:LLIN:CONT:INT:TYPE LIN
Preset
LINear
Not affected by Mode Preset, preset by Restore Mode Defaults
State Saved Saved in instrument state
Freq Reference
Specifies whether the limit line frequency points are coupled to the instrument
Center Frequency, and whether the frequency points are expressed as an offset
from the instrument Center Frequency. If the limit lines are specified with time, this
has no effect. The limit table must in this case support negative frequencies.
For example, assume you have a frequency limit line, and the instrument Center
Frequency is 1 GHz. If Relative to CF is Off, entering a limit line segment with a
frequency coordinate of 300 MHz displays the limit line segment at 300 MHz, and
the limit line segment does not change frequency if Center Frequency changes. If
Relative to CF is On, entering a limit line segment with a frequency coordinate of
300 MHz displays the limit line segment at CF + 300 MHz, or 1.3 GHz. Furthermore,
if Center Frequency changes to 2 GHz, the limit line segment is displayed at CF +
300 MHz, or 2.3GHz.
It is possible to change this setting after a limit line has been entered. When
changing from On to Off or vice versa, the frequency values in the limit line table
Spectrum Analyzer Mode User's &Programmer's Reference 397