3 Spectrum Analyzer Mode
3.2 Swept SA Measurement
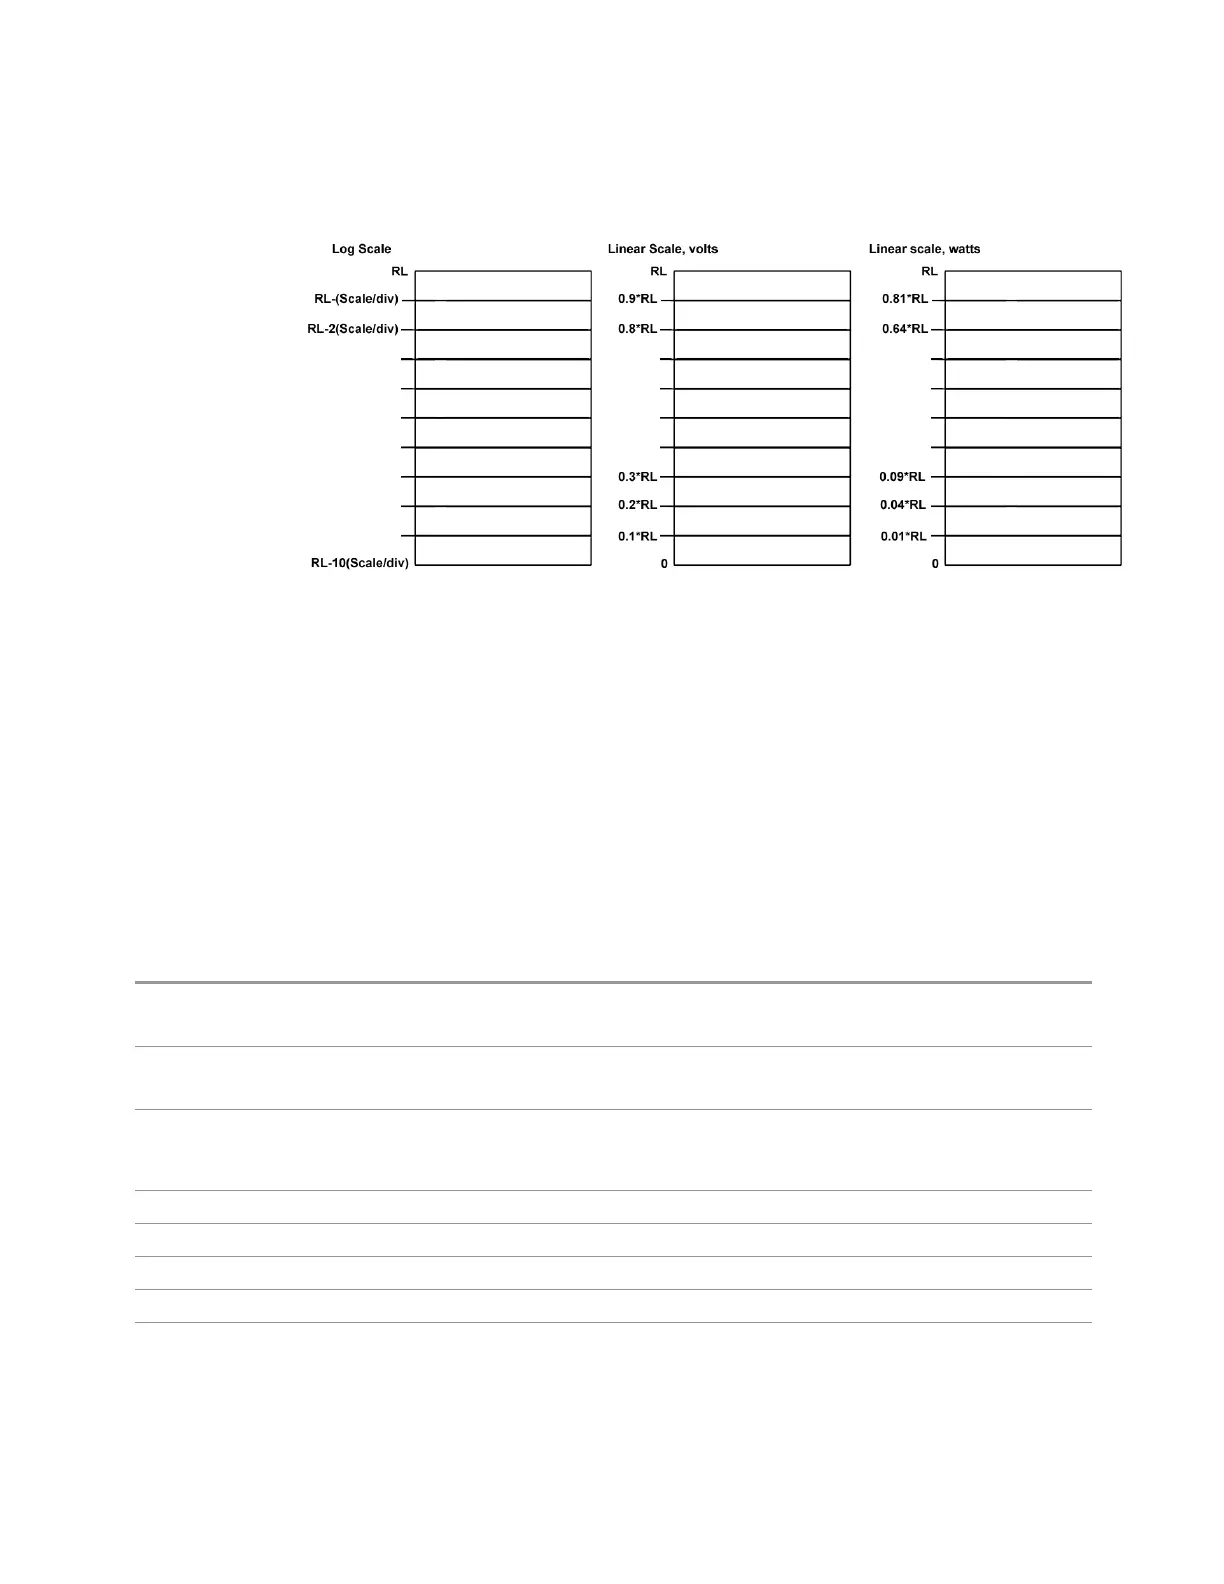
Scale/Div
For measurements that support a logarithmic Y-Axis, Scale/Div sets the height of
one division of the graticule in the current Y-Axis unit.
Scale/Div also determines the displayed amplitude range in the log plot graph.
Since there are usually 10 vertical graticule divisions in the display, the total
amplitude range of the graph is typically 10x this amount. For example, if Scale/Div
is 10dB, then the total range of the graph is 100dB.
In measurements that support both LOG and LIN settings for "Display Scale" on
page 205, this function is only available when Display Scale (Log) is selected, and
the vertical scale is power. When Display Scale (Lin) is selected, Scale/Div is grayed-
out.
Remote Command
:DISPlay:WINDow[1]:TRACe:Y[:SCALe]:PDIVision <rel_ampl>
:DISPlay:WINDow[1]:TRACe:Y[:SCALe]:PDIVision?
Example
:DISP:WIND:TRAC:Y:PDIV 5 DB
:DISP:WIND:TRAC:Y:PDIV?
Dependencies In measurements that support both LOG and LINDisplay Scales, Scale/Div is grayed-out in linear Y
scale. Sending the equivalent SCPI command does change Scale/Div, though it has no affect while in
LIN
Preset 10.00 dB / Div
State Saved Saved in instrument state
Min 0.10 dB
Max 20 dB
Annotation All measurements unless noted:
<value> dB/ left upper of graph
204 Spectrum Analyzer Mode User's &Programmer's Reference