3 Spectrum Analyzer Mode
3.2 Swept SA Measurement
Notes When the trace display is off, the trace is not tested. The trace is tested only when the trace display is
on and "Test Limits" on page 401 is ON
Couplings This matters when testing a trace or limit line for failure, via :CALC:LLIN3:FAIL? or
:CALC:TRAC2:FAIL?
Preset Limits 1 and 2 preset to 1, Limits 3 and 4 preset to 2, Limits 5 and 6 preset to 3
Not affected by Mode Preset, preset by Restore Mode Defaults
State Saved Saved in instrument state
Min 1
Max 6
Frequency Interpolation
This control is grayed-out if Time is the selected X Axis Unit.
Sets the interpolation between frequency points, allowing you to determine how
limit trace values are computed between points in a limit table. The available
interpolation modes are linear and logarithmic. If frequency interpolation is
logarithmic (Log), frequency values between limit points are computed by first
taking the logarithm of both the table values and the intermediate value. A linear
interpolation is then performed in this logarithmic frequency space. An exactly
analogous manipulation is done for logarithmic amplitude interpolation.
Note that the native representation of amplitude is in dB.
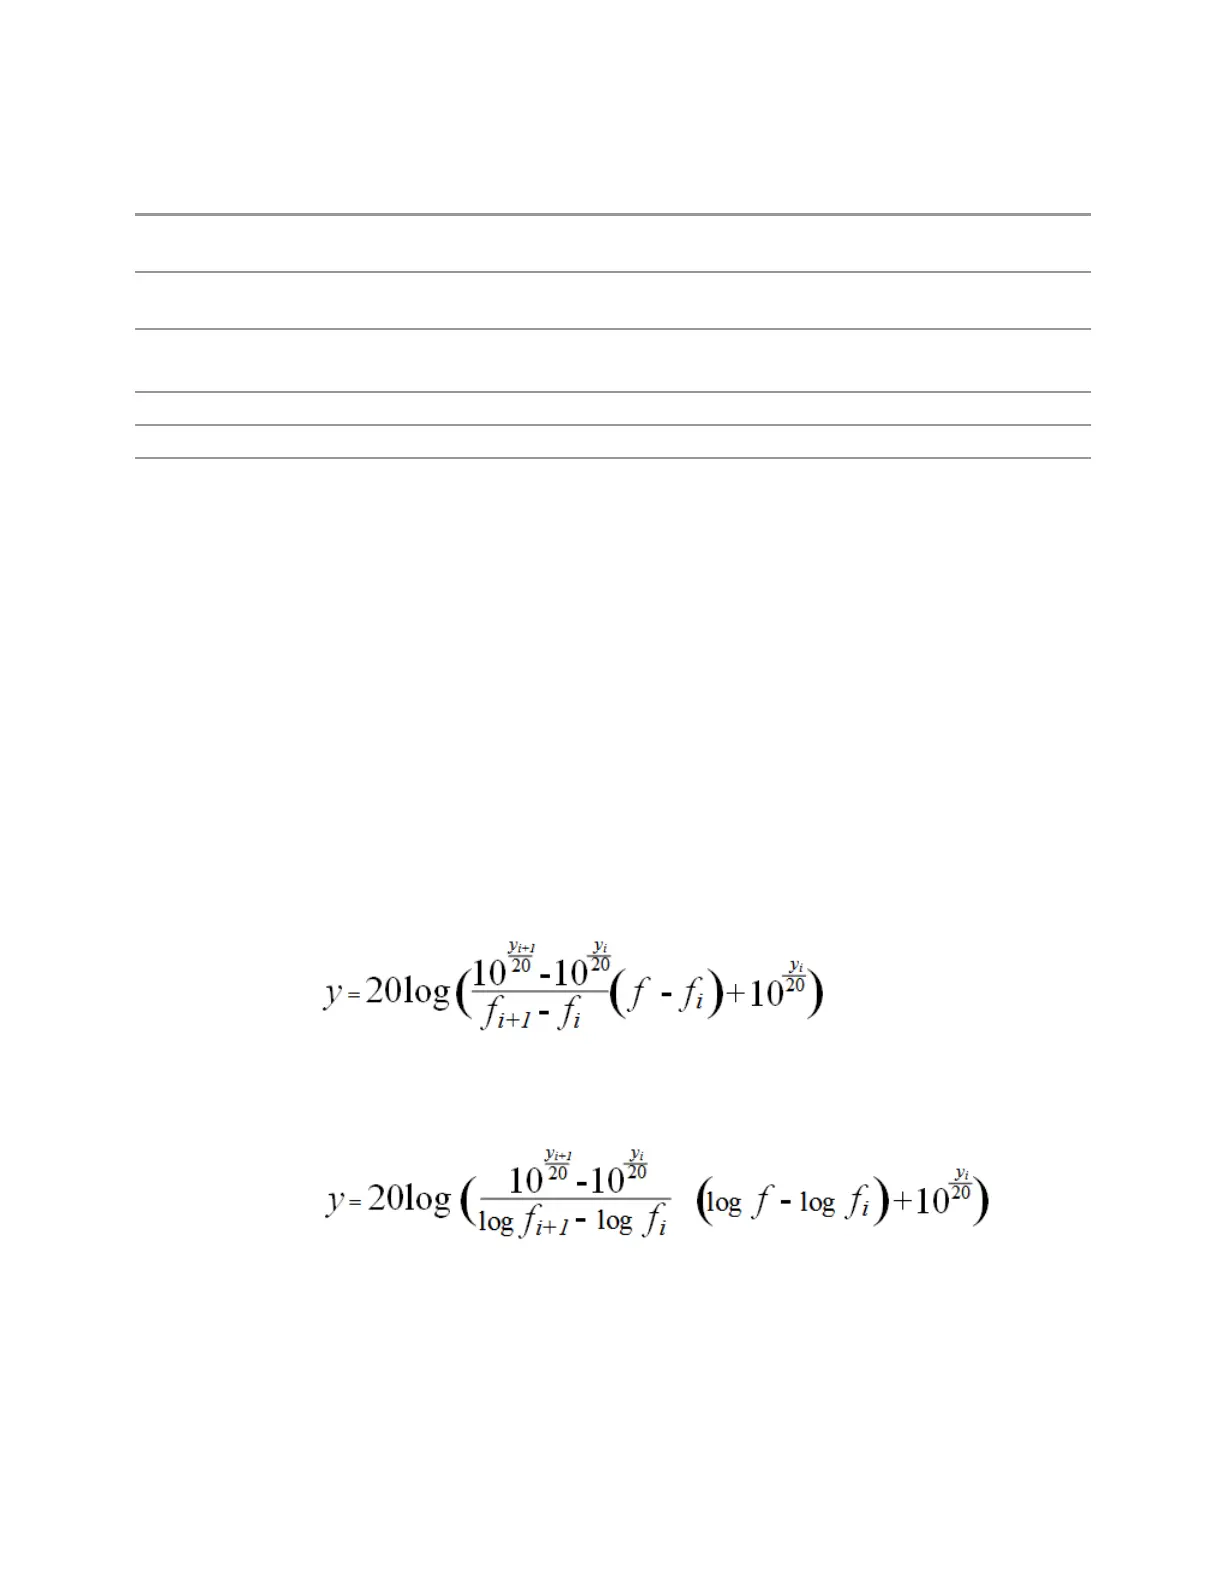
For linear amplitude interpolation and linear frequency interpolation, the
interpolation is computed as:
For linear amplitude interpolation and log frequency interpolation, the interpolation
is computed as:
For log amplitude interpolation and linear frequency interpolation, the interpolation
is computed as:
396 Spectrum Analyzer Mode User's &Programmer's Reference