3 Spectrum Analyzer Mode
3.2 Swept SA Measurement
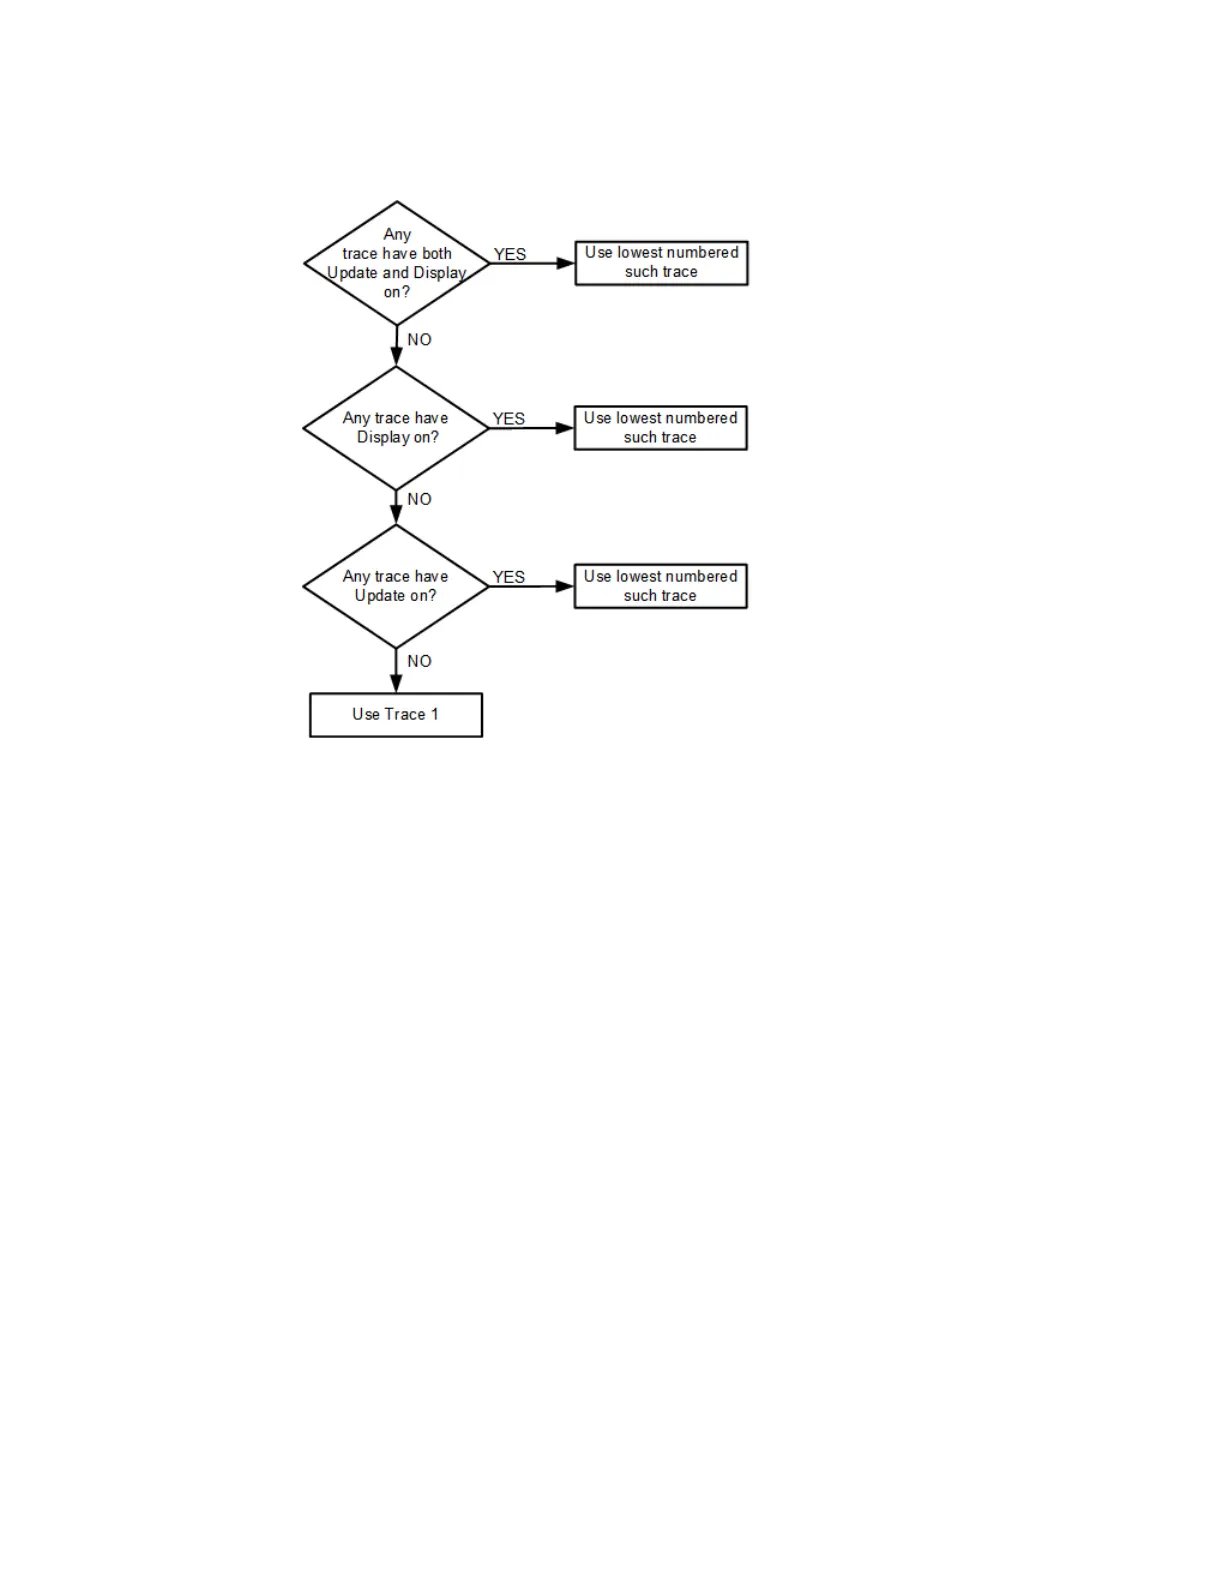
This flowchart makes it clear that putting all lower-numbered traces in View is the
simplest way to specify which trace you want the markers to go to when they turn
on. For example, if you want all Markers to go to Trace 2 when they turn on, put
Trace 1 in View.
Marker Settings Diagram
Lets you configure the Marker system using a visual utility. It is the same as "Marker
Settings Diagram" on page 318 on the Settings tab.
3.2.7.6 Marker Function
The controls on this tab allow you to control the marker functions of the instrument.
Marker Functions perform post-processing operations on marker data.
The Marker Function menu controls which marker functions are turned on and lets
you adjust the setup parameters for each function. These parameters include the
following, but only one parameter can be assigned to a given marker:
–
Marker Noise
–
Interval Power
Spectrum Analyzer Mode User's &Programmer's Reference 341