3 Spectrum Analyzer Mode
3.2 Swept SA Measurement
Although all 6 traces can be used in the trace window, it is the data from the “live”
Trace 1 that goes into Display Trace 0 and then into the Waterfall window. Thus, the
spectrogram represents the history of Trace 1; traces 2-6, although available, are
not written into the spectrogram. As you change the value of Display Trace, you see
the historical data only in Trace 1; Traces 2-6 still represent live data.
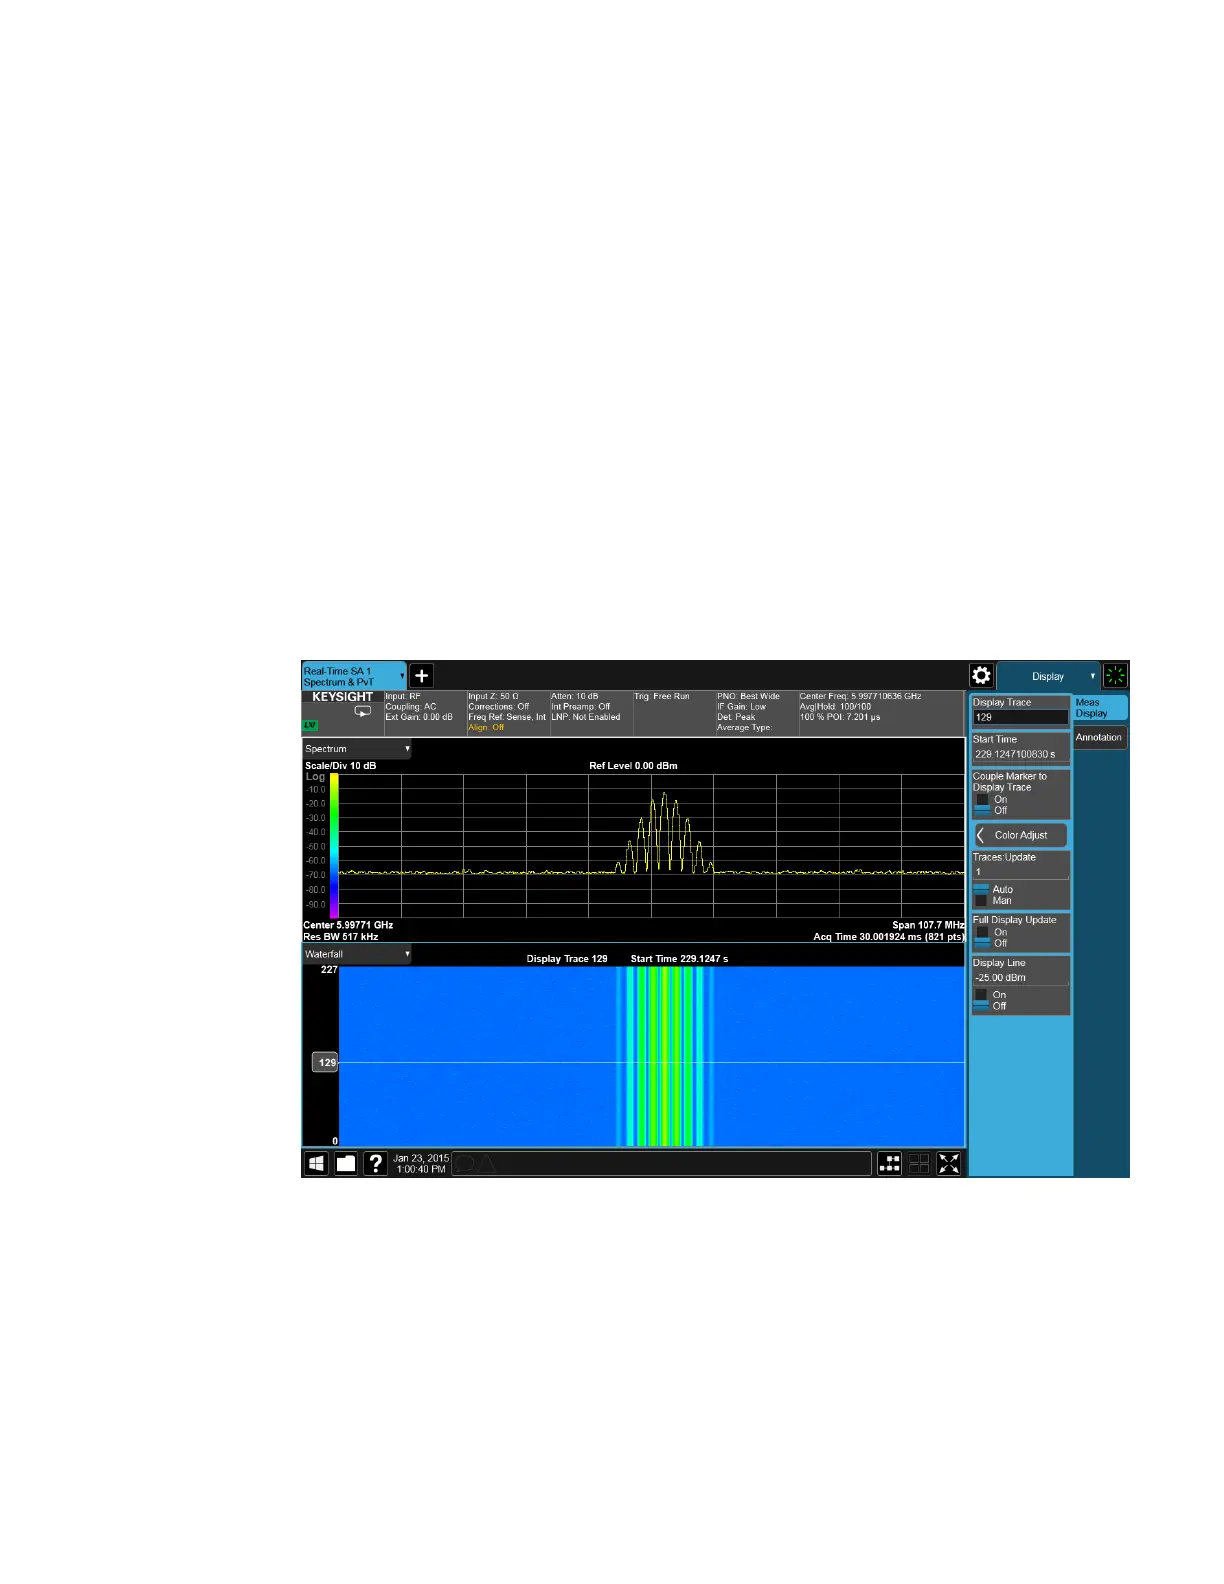
The Waterfall window itself can only hold 300 traces with the windows sized
normally. Since the Spectrogram memory can hold 1000 traces, this means that
often, many traces are off-screen above or below the Waterfall window. The oldest
trace is the topmost trace. The value of Display Trace is annunciated at the top of
the Waterfall window, along with the start time of that trace. You can tap the
Display Trace annunciator to enter a value for Display Trace.
The display trace also has a handle that sticks out on the left and contains the
display trace number. You can drag the display trace with this handle. The handle
outline is white, like the display trace. The display trace top and bottom is annotated
on the left side of the waterfall as in the figure below.
If the display trace is offscreen above, the handle outline is yellow, and the white line
becomes a dashed yellow line.
The waterfall can be scrolled up and down with your finger (hint: this works best if
you are in Single). Markers on the Waterfall can be dragged left, right, up or down to
any position on the waterfall.
Any variable change that restarts a sweep clears out the spectrogram and start it
over, unless you are in the idle state (Single sweep or waiting for a trigger), in which
Spectrum Analyzer Mode User's &Programmer's Reference 195
 Loading...


