9 Programming the Instrument
9.3 SCPI Operation and Results Query
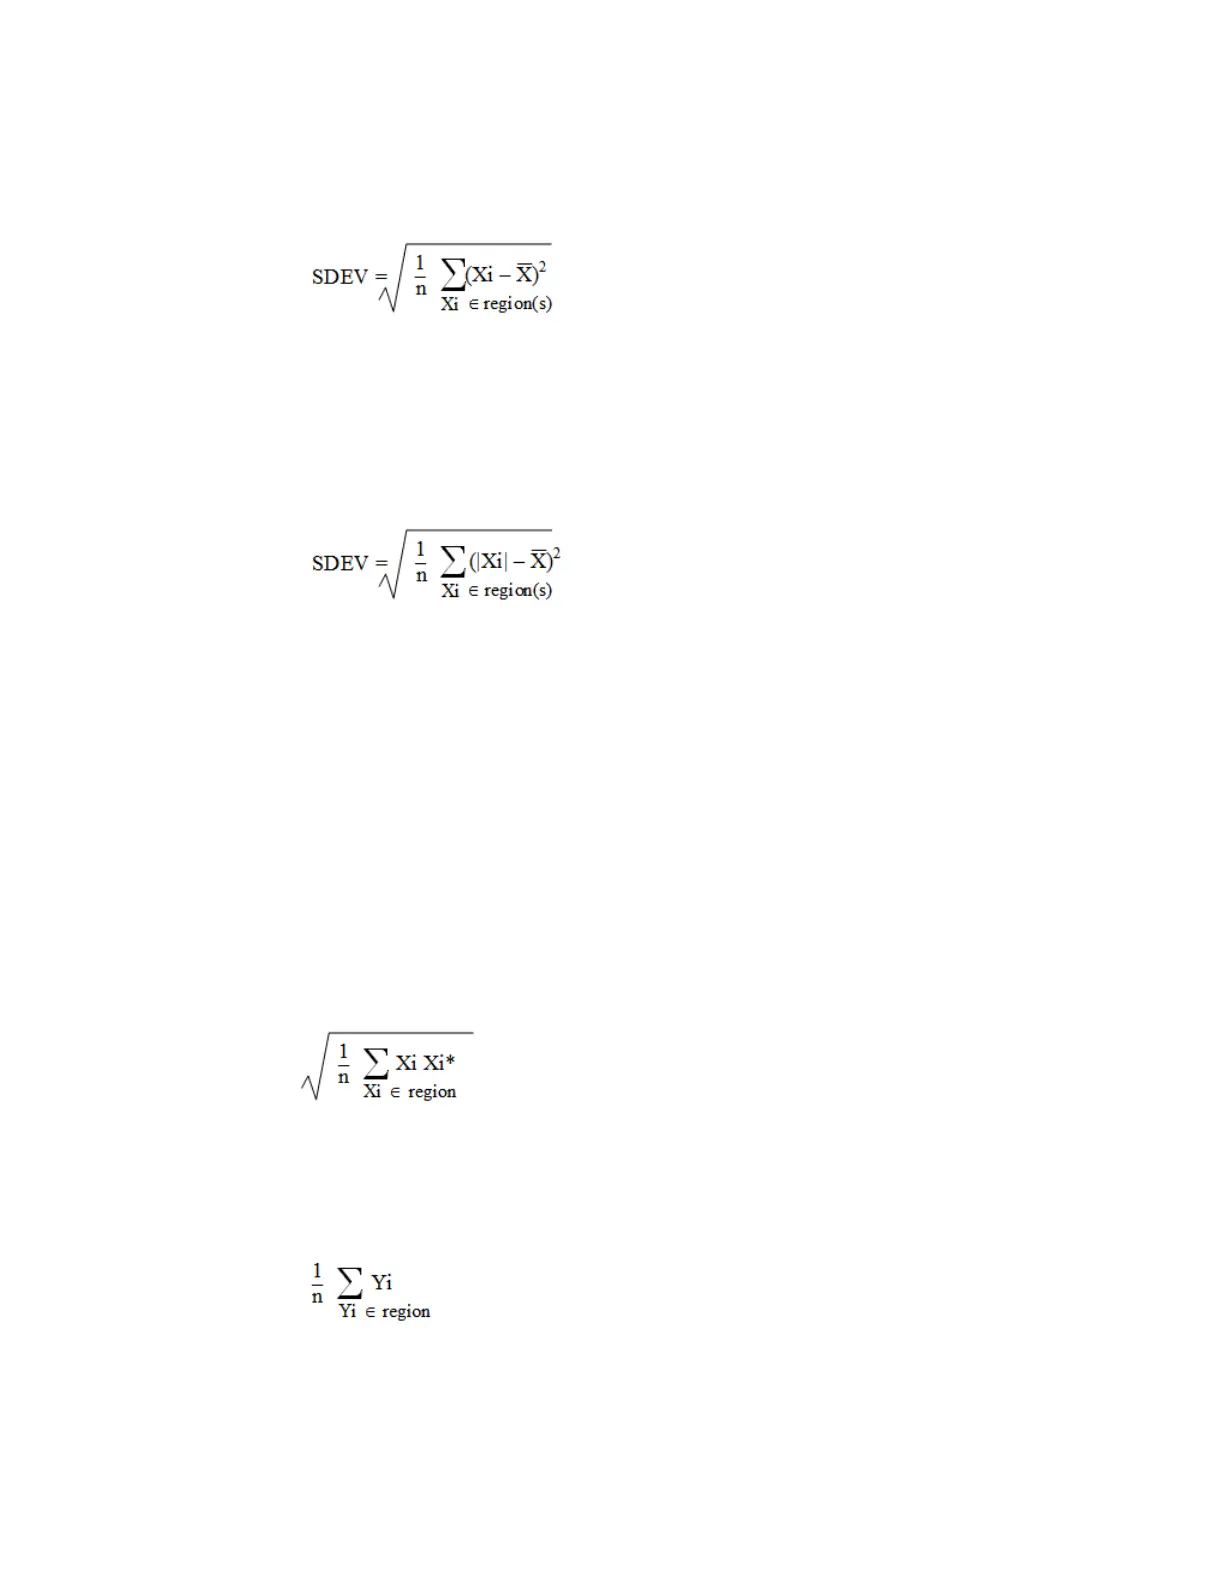
where Xi is a data point value, X is the arithmetic mean of the data point values for
the specified region(s), and n is the number of data points in the specified region(s).
For I/Q trace data, the standard deviation of the magnitudes of the I/Q pairs is
returned. See the following equation.
Equation 7: Standard Deviation of I/Q Data Pair Values for Specified Region(s)
where |Xi| is the magnitude of an I/Q pair, X is the mean of the magnitudes for the
specified region(s), and n is the number of data points in the specified region(s).
PPHase
Returns the x,y pairs of both rms power (dBm) and arithmetic mean phase (radian)
for every specified region and frequency offset (Hz). The number of pairs is defined
by the specified number of regions. This parameter can be used for I/Q vector (n=0)
in Waveform (time domain) measurement and all parameters are specified by data
point in PPHase.
The rms power of the specified region may be expressed as:
Power = 10 x log [10 x (RMS I/Q value)] + 10.
The RMS I/Q value (peak volts) is:
where Xi is the complex value representation of an I/Q pair, Xi* its conjugate
complex number, and n is the number of I/Q pairs in the specified region.
The arithmetic mean phase of the specified region may be expressed as:
where Yi is the unwrapped phase of I/Q pair with applying frequency correction and
n is the number of I/Q pairs in the specified region.
2765 Spectrum Analyzer Mode User's &Programmer's Reference

 Loading...


