3 Short-Range Comms & IoT Mode
3.3 LoRa (CSS) Demodulation Measurement
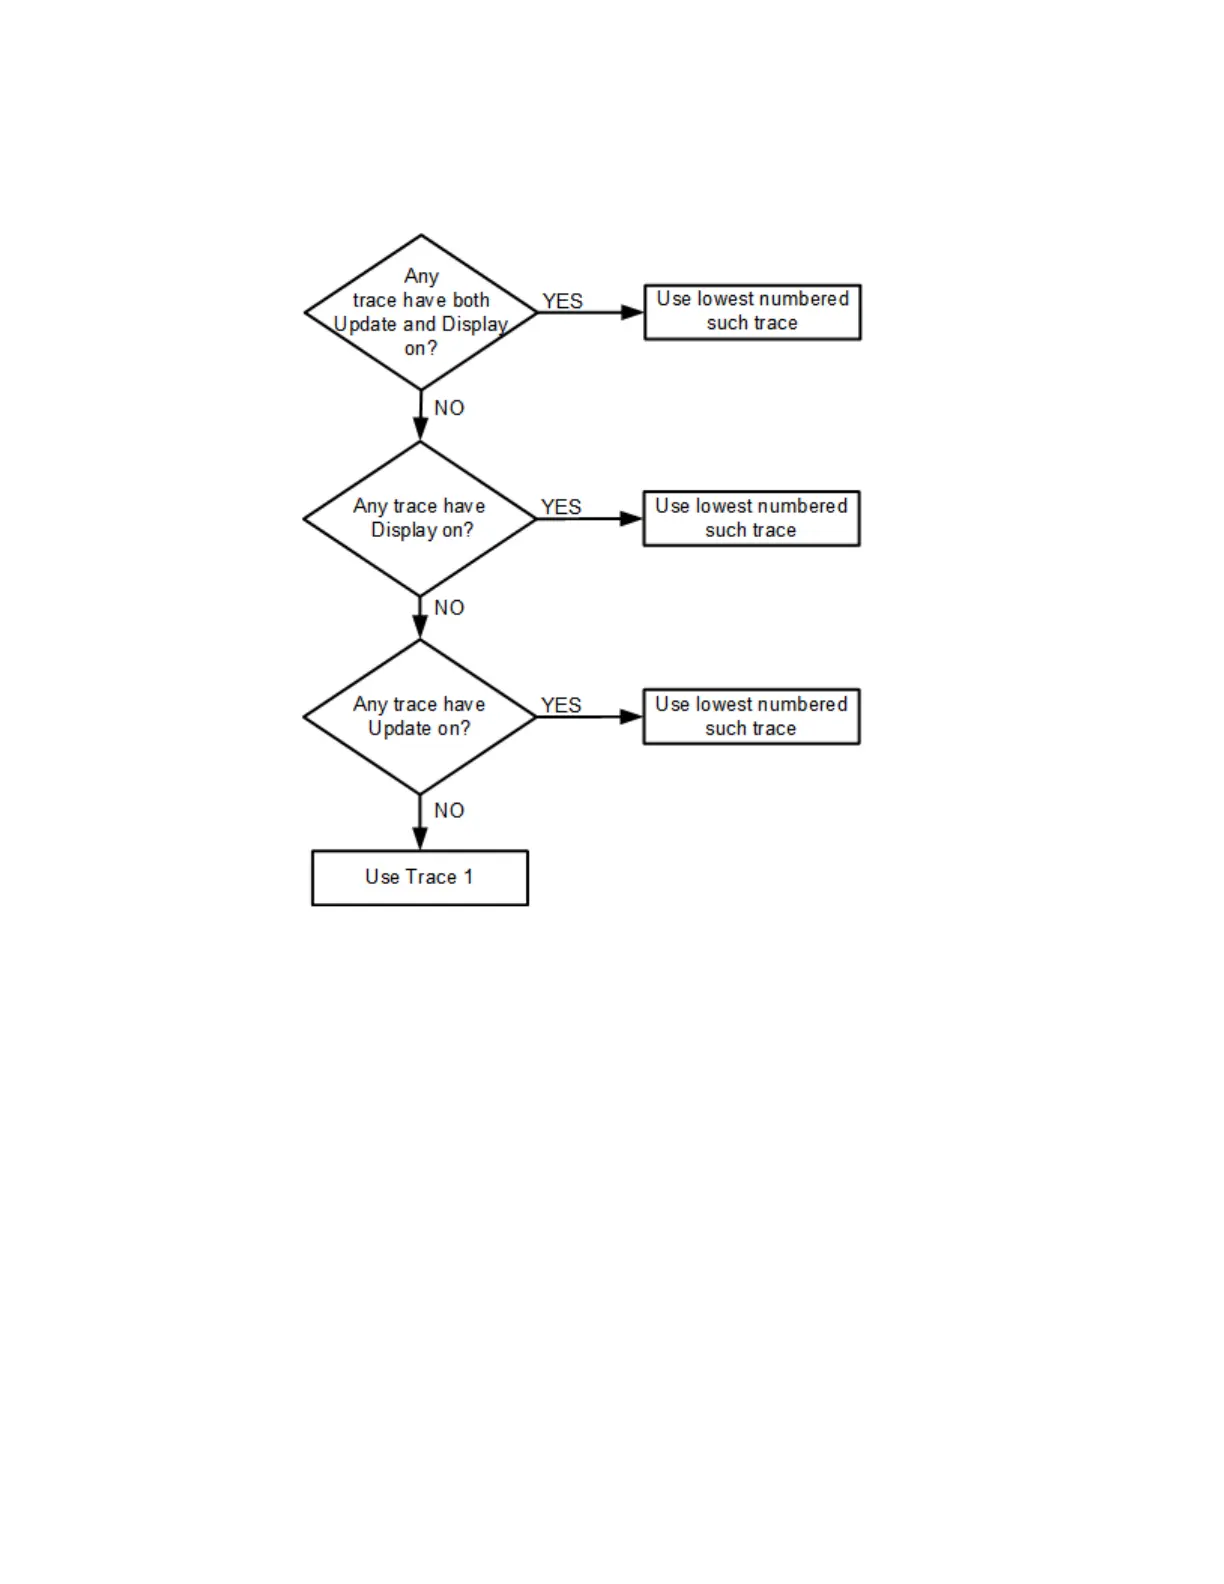
This flowchart makes it clear that putting all lower-numbered traces in View is the
simplest way to specify which trace you want the markers to go to when they turn
on. For example, if you want all Markers to go to trace 2 when they turn on, put trace
1 in View.
Marker Settings Diagram
Configures the markers in a visualized manner. This is the same as the "Marker
Settings Diagram" on page 390 in the Setting tab.
3.3.7.5 Marker ->
The controls on the Marker -> tab provide a way to copy the current marker value
into other instrument parameters (for example, the center frequency).
Short Range Comms & IoT Mode User's &Programmer's Reference 397
 Loading...


