3 Short-Range Comms & IoT Mode
3.7 ACP Measurement
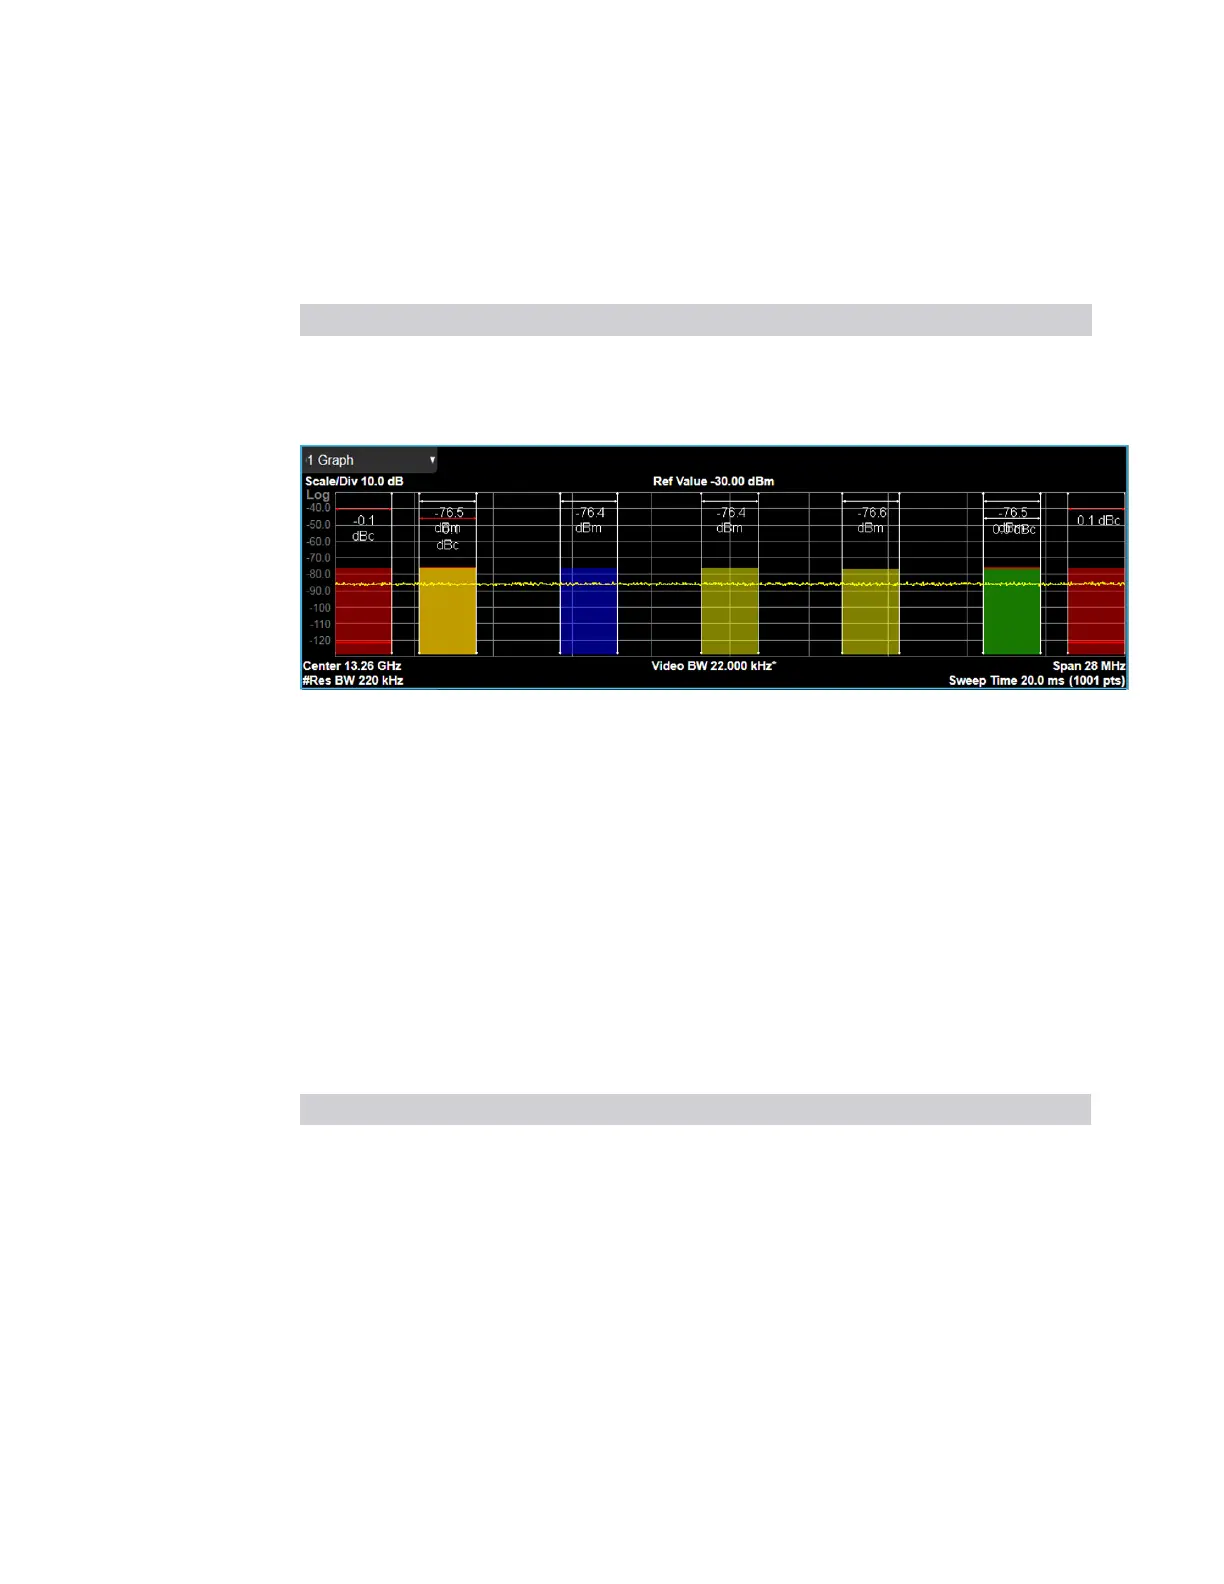
The results of the measurement can be displayed as a single spectrum trace view or
displayed with a Bar Graph trace on the spectrum trace.
The Graph window appears in several Views, as follows:
View Size Position
Normal Half, full width Top
Carrier Info Half, full width Top
Gate View One third, full width Middle
When the Bar Graph is ON and Limit Test is ON, the color of each bar graph reflects
the limit test result. When the limit test fails, the bar color is red, and when limit test
passes, the bar color is green.
When RBW is selected as the measurement method, the spectrum trace is not
displayed, only the bar graph is displayed. In addition, the Bar Graph control (under
the Display front-panel key) is set to ON and is grayed-out.
3.7.7.2 Metrics
Window # 2 & 3
Displays the textual results of the ACP measurement.
Views in which the Metrics window appears:
View Size Position
Normal Half, full width Bottom
Carrier Info Half, full width Bottom
Gate View One Third, full width Bottom
Metrics Window in Normal view:
786 Short Range Comms & IoT Mode User's &Programmer's Reference
 Loading...


