3 Short-Range Comms & IoT Mode
3.3 LoRa (CSS) Demodulation Measurement
When averaging is on, the column marked “current” is relabeled with “average” and
the results in that column are averaged over the coming measurement cycles until
the average/hold number is reached. After that, for continuous mode, exponential
averaging will be applied for the successive measurement cycles.
The max hold column shows the maximum results obtained since the previous
restart when averaging is on, and shows “---” when averaging is off.
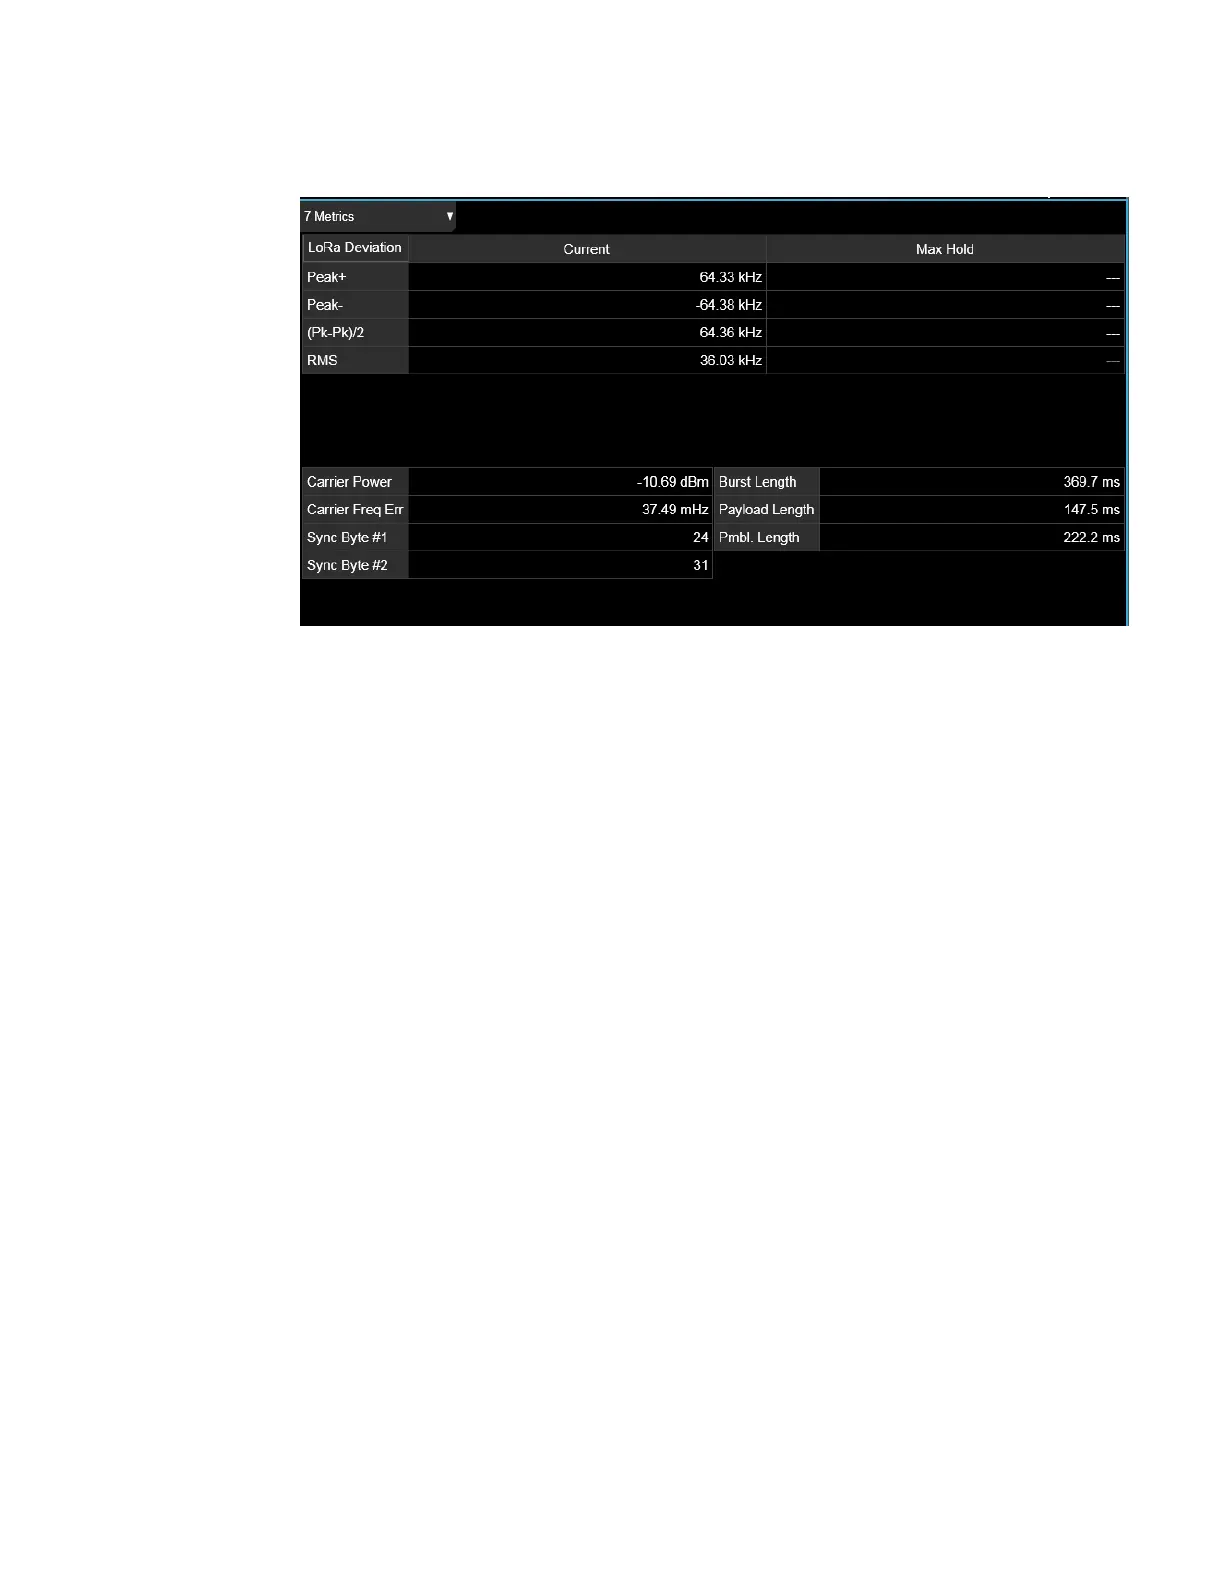
3.3.2.8 Result Table
The Result Table window displays measurement results as noted below:
Carrier Power Represents the average power detected at the carrier frequency
Carrier
Frequency
Error
Represents the difference between the instrument’s tuned center frequency and the detected carrier’s
frequency
Deviation
Peak+
Represents the maximum value of the frequency deviation during the acquisition period
The impact of the frequency drift will be removed before the calculation
Deviation
Peak-
Represents the minimum value of the frequency deviation during the acquisition period
The impact of the frequency drift will be removed before the calculation
Deviation (Pk –
Pk)/2
Represents the half of the difference between the deviation Peak+ and Peak-
Deviation RMS Represents the RMS frequency deviation during the acquisition period
RMS Ratio Represents the ratio between the displayed value of RMS modulation and the ratio reference (see below).
This result is only displayed when “RMS ratio” is selected under Display->Metrics Settings
Ratio
Reference
Represents the reference value used for calculating the RMS ratio
This value is only displayed when “RMS Ratio” is selected
322 Short Range Comms & IoT Mode User's &Programmer's Reference
 Loading...


