3 Short-Range Comms & IoT Mode
3.5 Channel Power Measurement
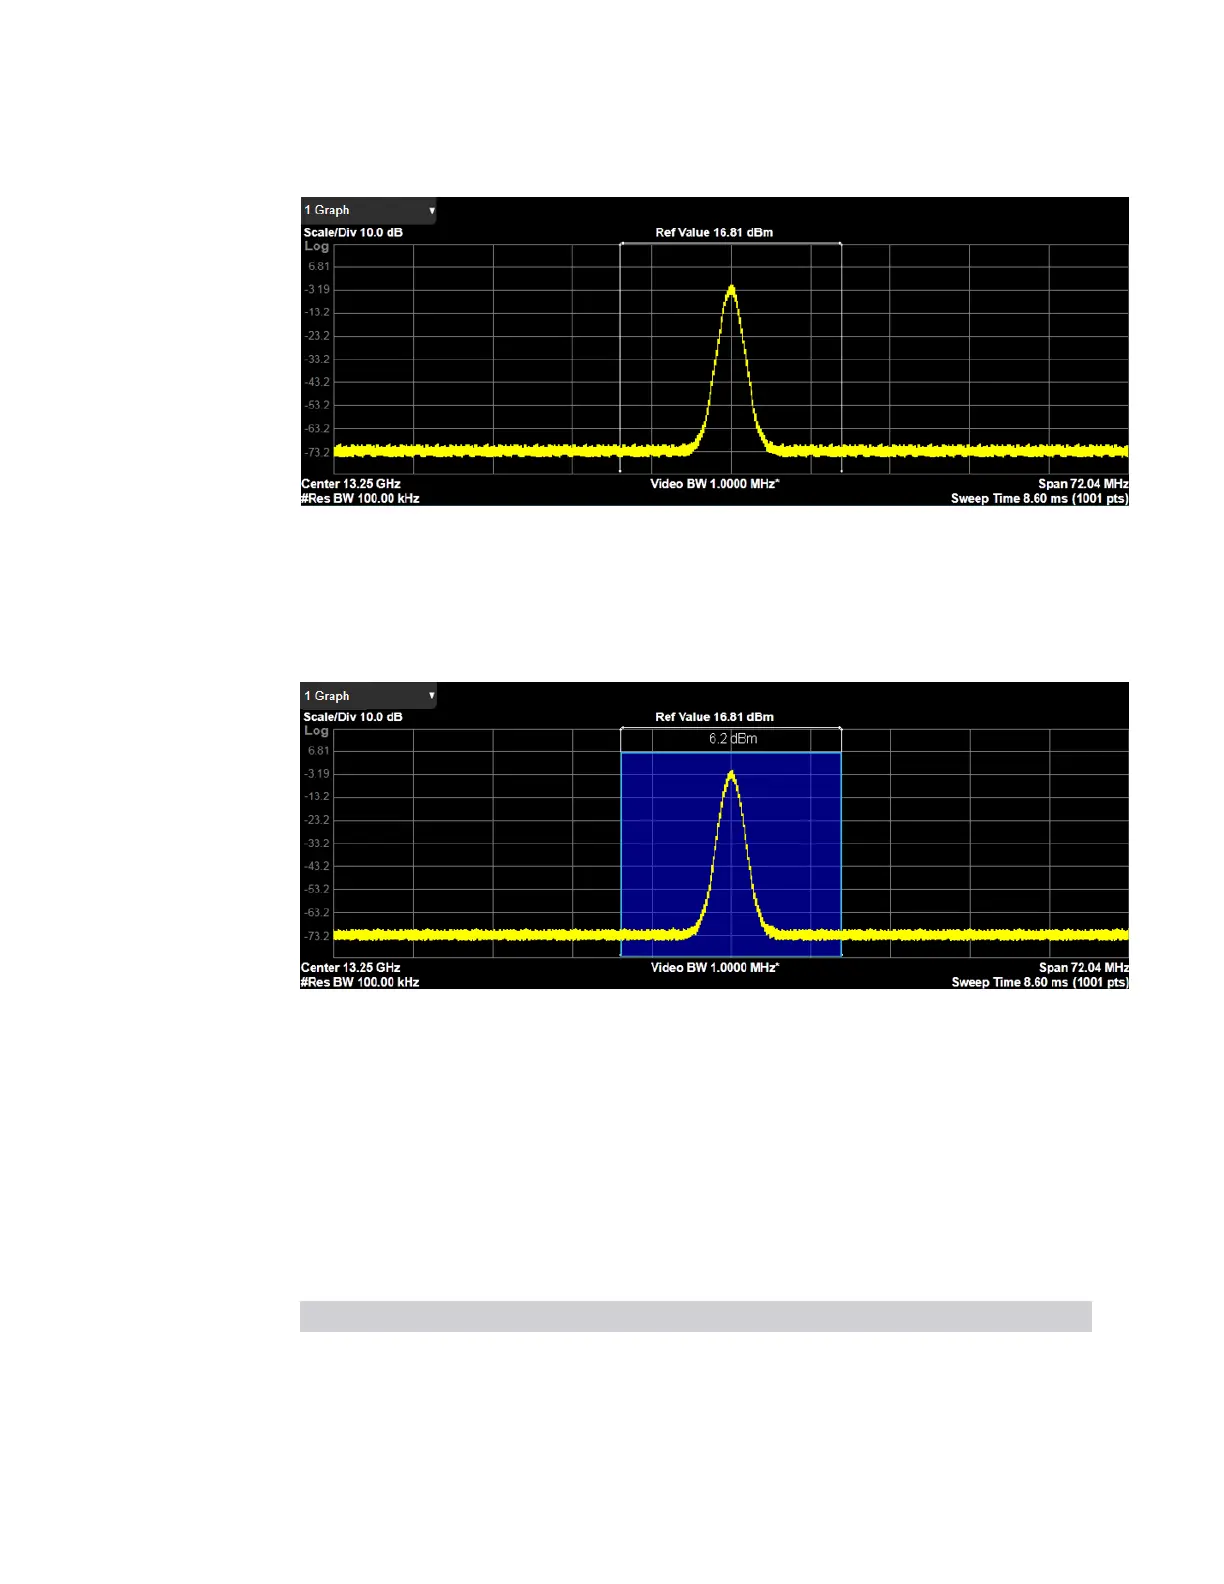
Spectrum View with Bar Graph On
This is the same as the Spectrum view, but has a blue bar between the markers that
indicates the measured output power level. The bar graph is activated when the “Bar
Graph” control is set to ON under the Display hardkey. The actual measured output
power level is displayed on the display at the top of the bar.
If the current Mode is WLAN and the format is WLAN 802.11ac 80+80 MHz,
Spectrum View is slightly different so that the results of both carrier segments can
be displayed.
3.5.2.2 Metrics
Window #2
The actual measured output power level is displayed in the Metrics window
The Metrics window appears in the following Views.
View Size Position
Normal One third, full width Bottom
Gate View One third, full width Bottom
550 Short Range Comms & IoT Mode User's &Programmer's Reference
 Loading...


