Camera Image Input FHFH/FZ5 Processing Item Function Reference Manual
63
1
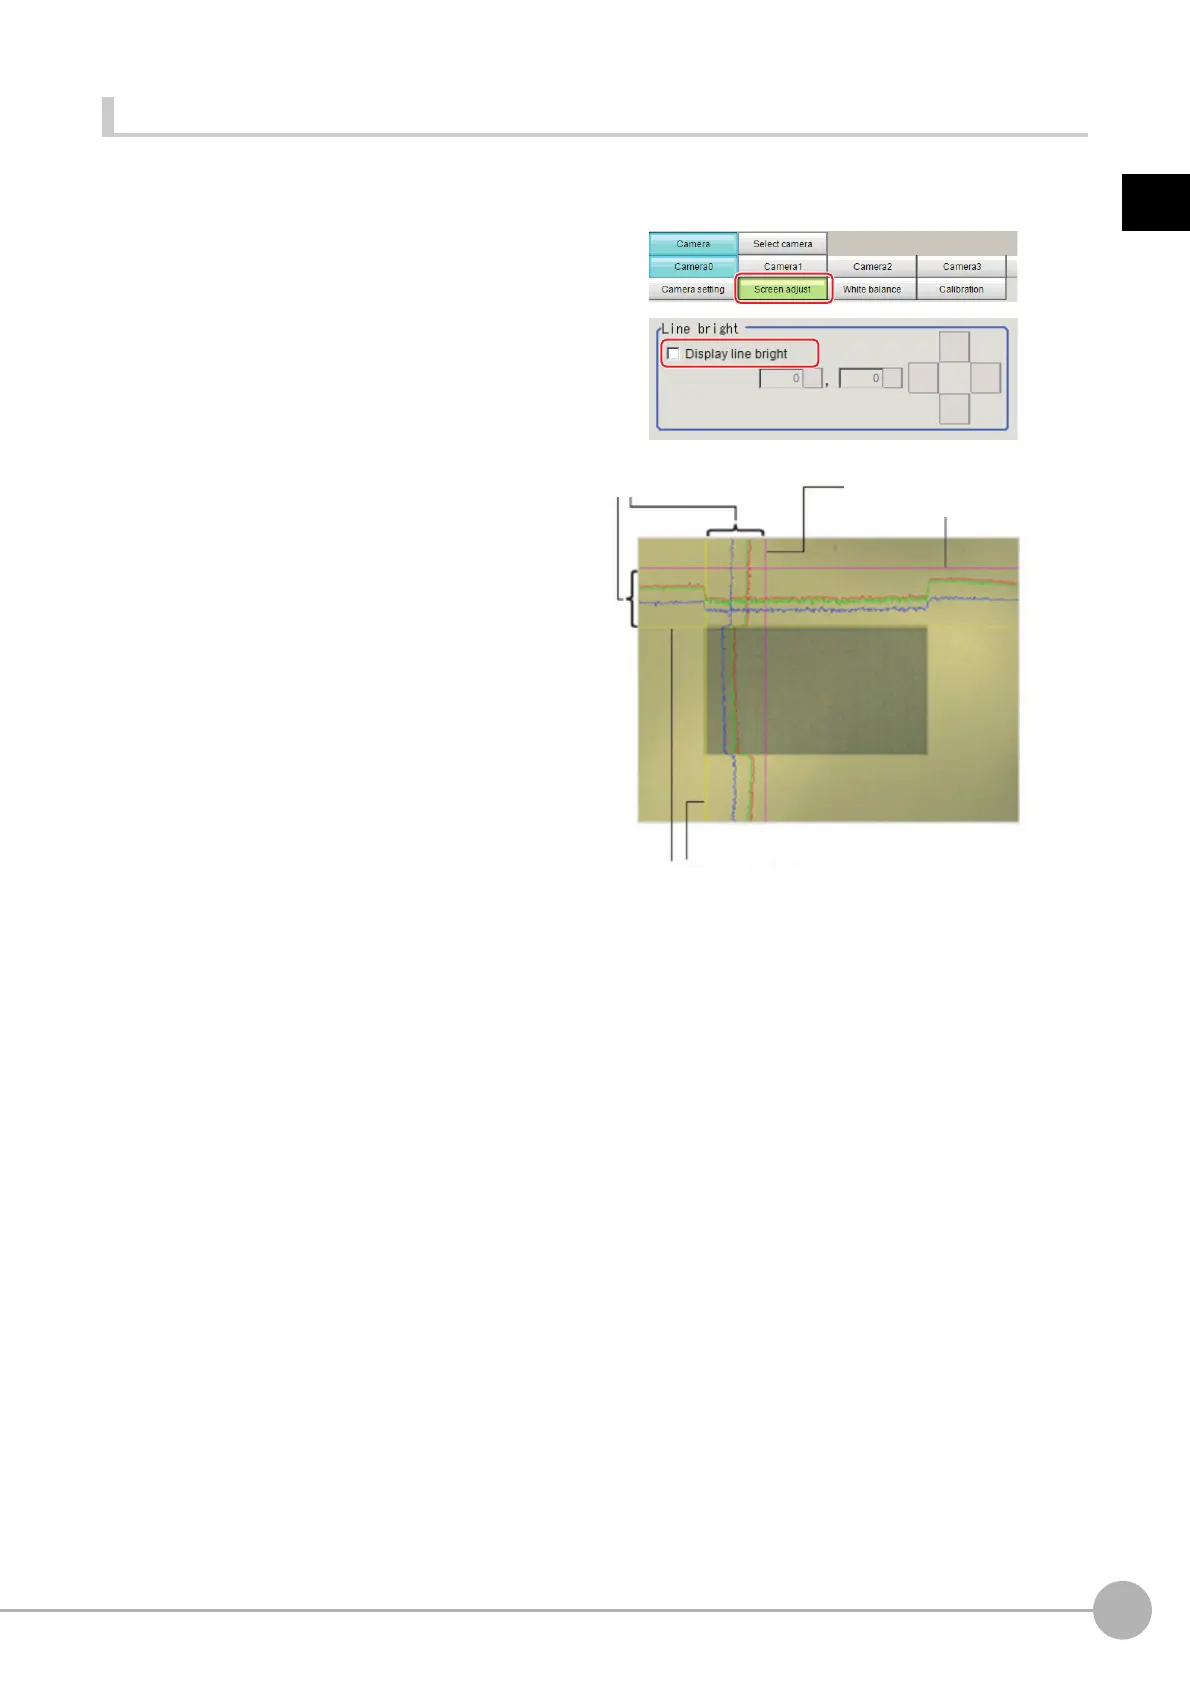
Input image
Line Bright
The graph showing the gray distribution for 1 line in the image is called the "Line bright". You can display the line
brights for R, G and B for any horizontal or vertical line.
1 In the Item Tab area, click [Screen
adjust].
2 Place a check at "Display line bright".
3 Move the line to the position whose
density distribution you want to see.
R, G, B graph lines
Max. density value (red)
Indicates the max. density value.
Coordinate axis (yellow)
This line is moved to the location in which
density is to be checked.
 Loading...