Trend Monitor
664
FH/FZ5 Processing Item Function Reference Manual
Display Range (Trend Monitor)
If what you want to see is not on the screen, scroll the graph up and down or zoom in/out.
Also, items displayed horizontally can be toggled.
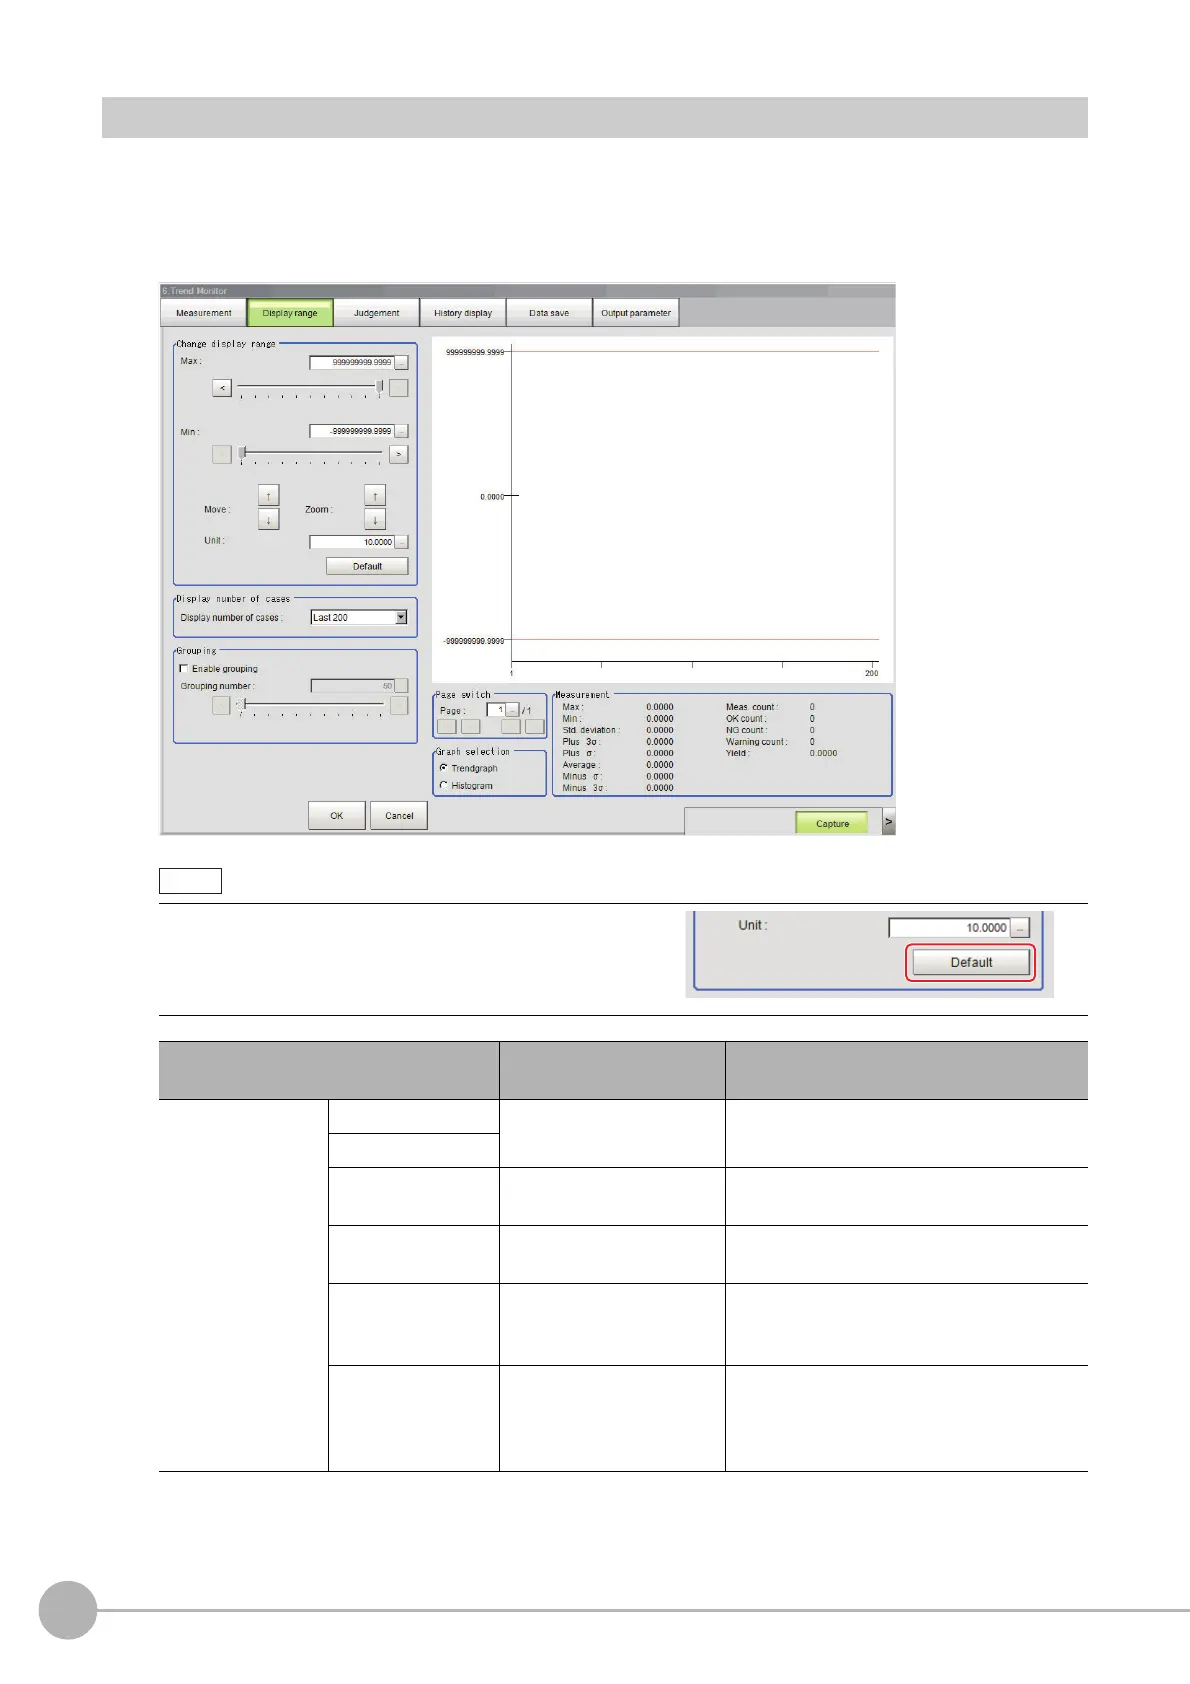
1 In the Item Tab area, click [Display range].
A graph is displayed in the "Image Display" area.
• If the window is entered after measurement is performed
a few times and [Default] is clicked on, a display range
suitable for these measurement values is automatically
set.
Setting item
Set value
[Factory default]
Description
Change display
range
Max
-9999
99999.9999
to 999999999.9999
Sets the upper (highest value) and lower
(lowest value
) sections of the graph.
Min
Move
• ↑
• ↓
Moves up and down the graph itself.
Zoom
• ↑
• ↓
Zooms the graph itself in and out.
Unit 1 to 1000000.0000
Sets the amount of vari
ation gen
erated when
the up/down buttons for moving or zooming
in/out are pushed.
Default -
If several measurements have already been
ma
de, an optimal display range is
automatically set based on the
measurement results.
 Loading...