C613-50631-01 Rev A Command Reference for IE340 Series 302
AlliedWare Plus™ Operating System - Version 5.5.3-0.x
SYSTEM CONFIGURATION AND MONITORING COMMANDS
SHOW
MEMORY
show memory
Overview This command displays the memory used by each process that is currently
running.
For information on filtering and saving command output, see the “Getting Started
with AlliedWare Plus” Feature Overview and Configuration Guide.
Syntax
show memory [sort {size|peak|stk}]
Mode User Exec and Privileged Exec
Example To display the memory used by the current running processes, use the command:
awplus# show memory
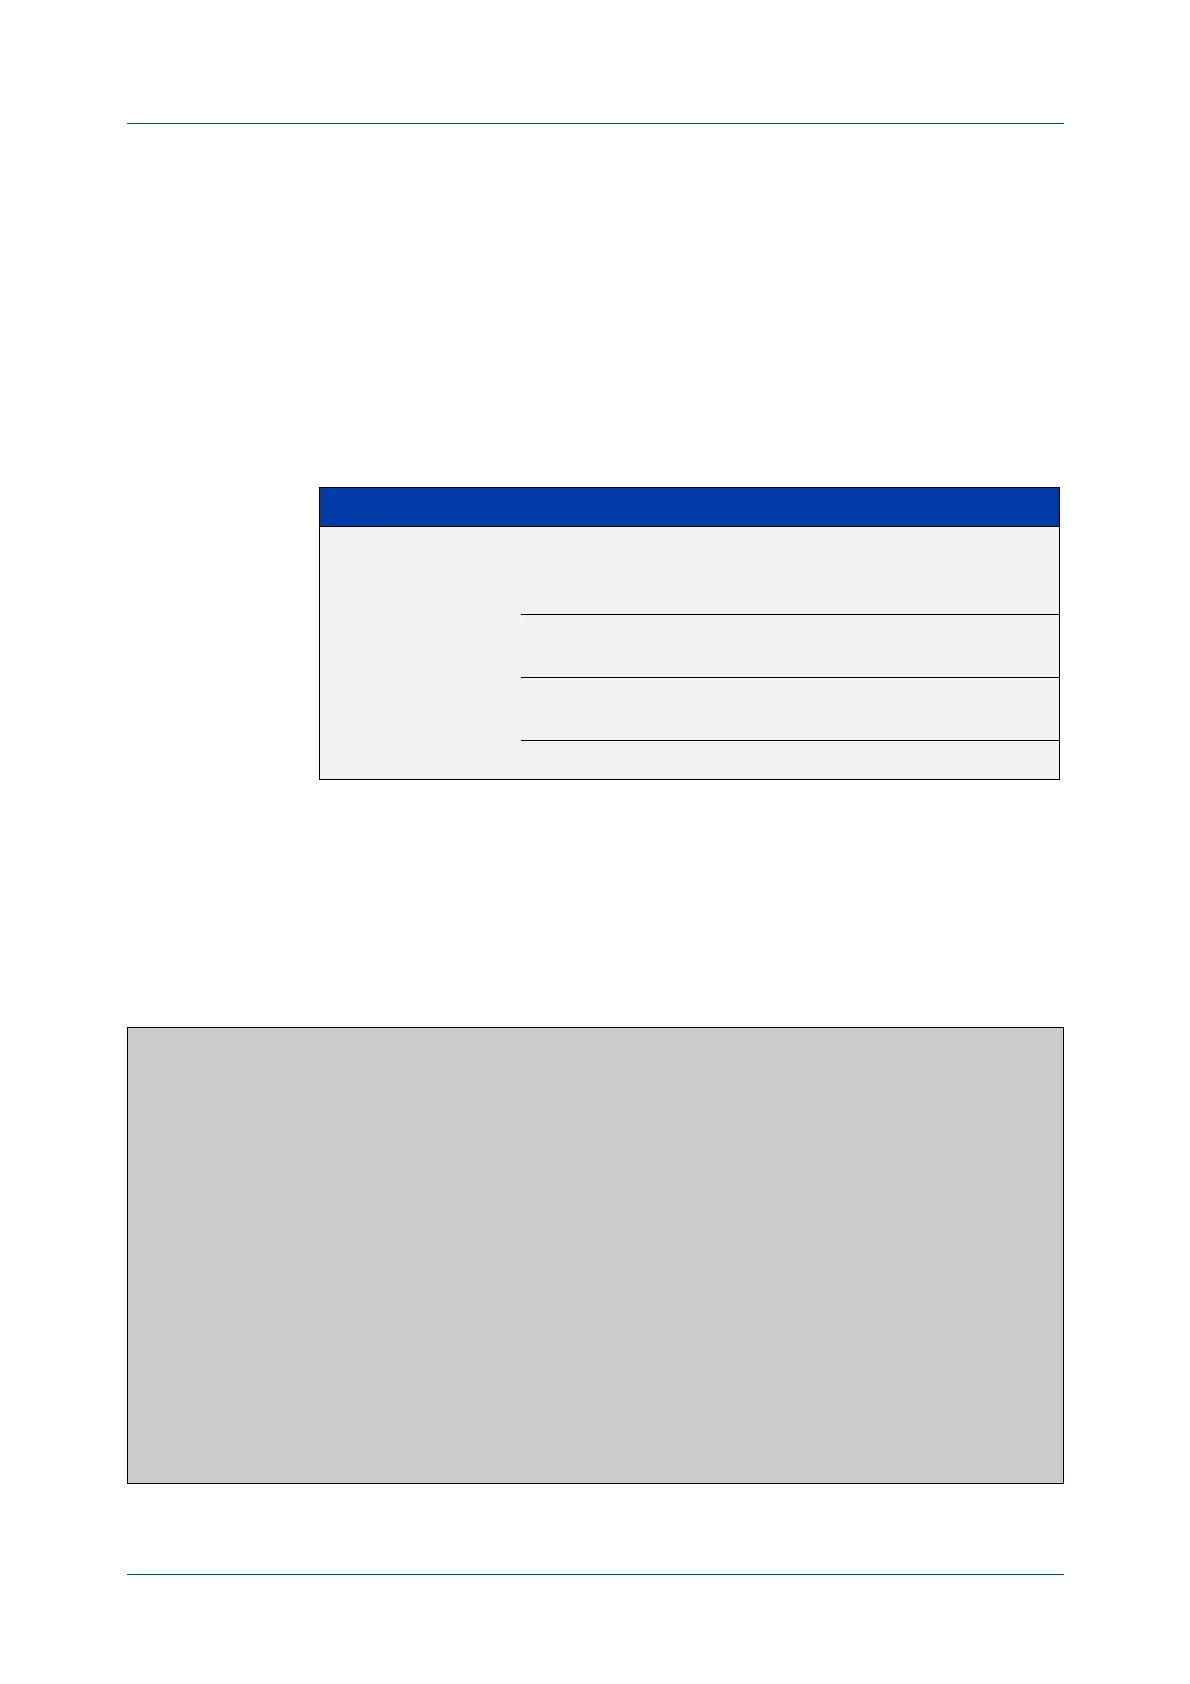
Output Figure 7-10: Example output from show memory
Parameter Description
sort Changes the sorting order for the list of processes. If you do not
specify this, then the list is sorted by percentage memory
utilization.
size Sort by the amount of memory the process is
currently using.
peak Sort by the amount of memory the process is
currently using.
stk Sort by the stack size of the process.
awplus#show memory sort stk
RAM total: 124384 kB; free: 64236 kB; buffers: 15888 kB
user processes
==============
pid name mem% size(kB) peak(kB) data(kB) stk(kB) virt(kB)
490 openhpid 1.5 1988 7480 1308 528 6704
578 hsl 7.1 8940 29312 5148 312 21052
18986 imish 1.3 1660 13668 3876 172 13668
18931 imish 3.6 4548 13668 3876 172 13668
576 imi 4.6 5772 14532 4428 144 14532
572 nsm 4.9 6128 15092 4480 140 15092
574 hostd 1.6 2048 8116 1876 140 8116
586 cntrd 2.5 3168 12140 3288 140 12136
606 sflowd 2.8 3564 12336 3408 140 12336
610 authd 3.0 3808 12604 3472 140 12604
616 mstpd 3.1 3856 12652 3480 140 12652
...

 Loading...